Non-Farm Payrolls Preview: Is the Inflection Point on the Horizon?

Entry posted by MongiIG in Market News
541 views
The job data in the United States is poised to attract full attention this week. Will the upcoming non-farm payrolls report for June bring "surprises" or "shocks"? And how will it impact the trajectory of the US dollar?
 Source: Bloomberg
The job data in the United States takes centre stage in the first week of 2H, 2023, including the non-farm payrolls report, unemployment rate and new job openings. Over the past 12 releases, the reported figures for non-farm payrolls have surpassed expectations 11 times. Will the forthcoming non-farm payrolls report bring forth further "upside surprises" or mark an "inflection point"? Furthermore, what impact will it have on the trajectory of the US Dollar?
Non-farm Payrolls June Report Preview
Non-farm payrolls data from the United States has consistently surpassed expectations this year, with a noticeable upward trend over the past three months (as shown in the chart below).
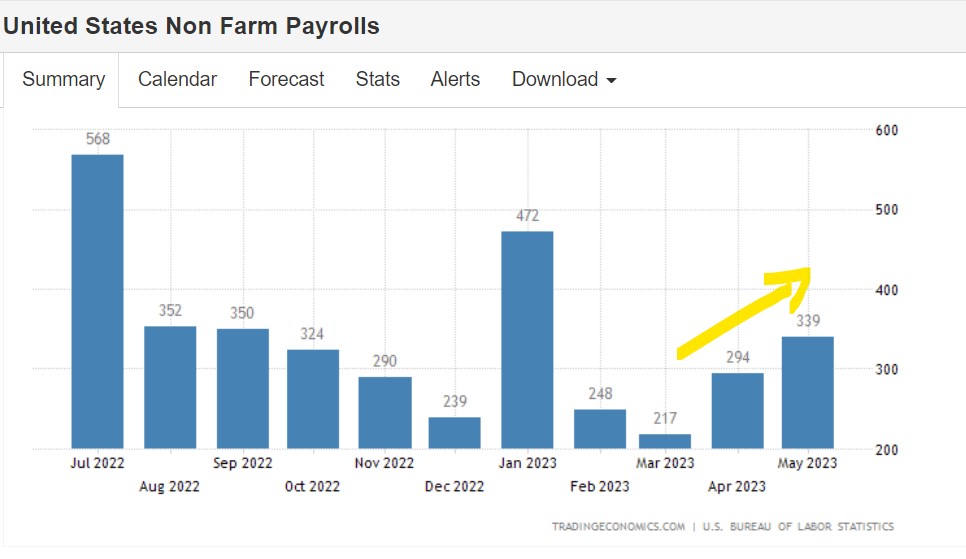
Furthermore, the most recent data indicates that the US job market remains strong and resilient. For example, the number of initial jobless claims, announced last week, decreased by 26,000 compared to the previous week. This marked the largest drop since October 2021 and was lower than market expectations.
Hence, If the upcoming data for June can reverse its uptrend in the past three months and stay close to the anticipated figure, it may provide some temporary relief for the Federal Reserve and the market. Currently, it is projected that the country will add 225,000 non-farm jobs in June, a significant decrease from May's figure of 339,000.
Job data and Fed’s rate hike
The increasing attention on the employment market data in the United States is primarily due to the growing realization that the extremely tight job market has clearly become the most challenging obstacle for the Federal Reserve to address in controlling inflation.
From the economic projections released by the Federal Reserve in June, it is evident that the resilience of the US job market has caught them somewhat off guard. One of the most notable adjustments made by the Fed was the downward revision of the unemployment rate for the next two years. The Fed anticipates that the US unemployment rate will remain around only 4% during this period, suggesting that the heat in the job market, often accompanied by rising labor costs and elevated demand, is likely to continue supporting lingering and sticky inflation.
In that case, the options available to the Fed are either to maintain a hawkish stance on tightening until inflation is convincingly under control or to be prepared to rush to adjust its rates in response to unexpected inflation flare-ups.
Since June’s FOMC meeting, there has been a consistent message to the market about the Fed's determination to continue tightening. Fed Chairman Powell has even explicitly stated that the Fed plans to raise rates at least two times or more. As a result, according to CME fed watch, the probability of a July rate hike by the Federal Reserve has increased significantly to 86%, up from 50% just a month ago.
July rate hike expectation

US Dollar Technical Analysis
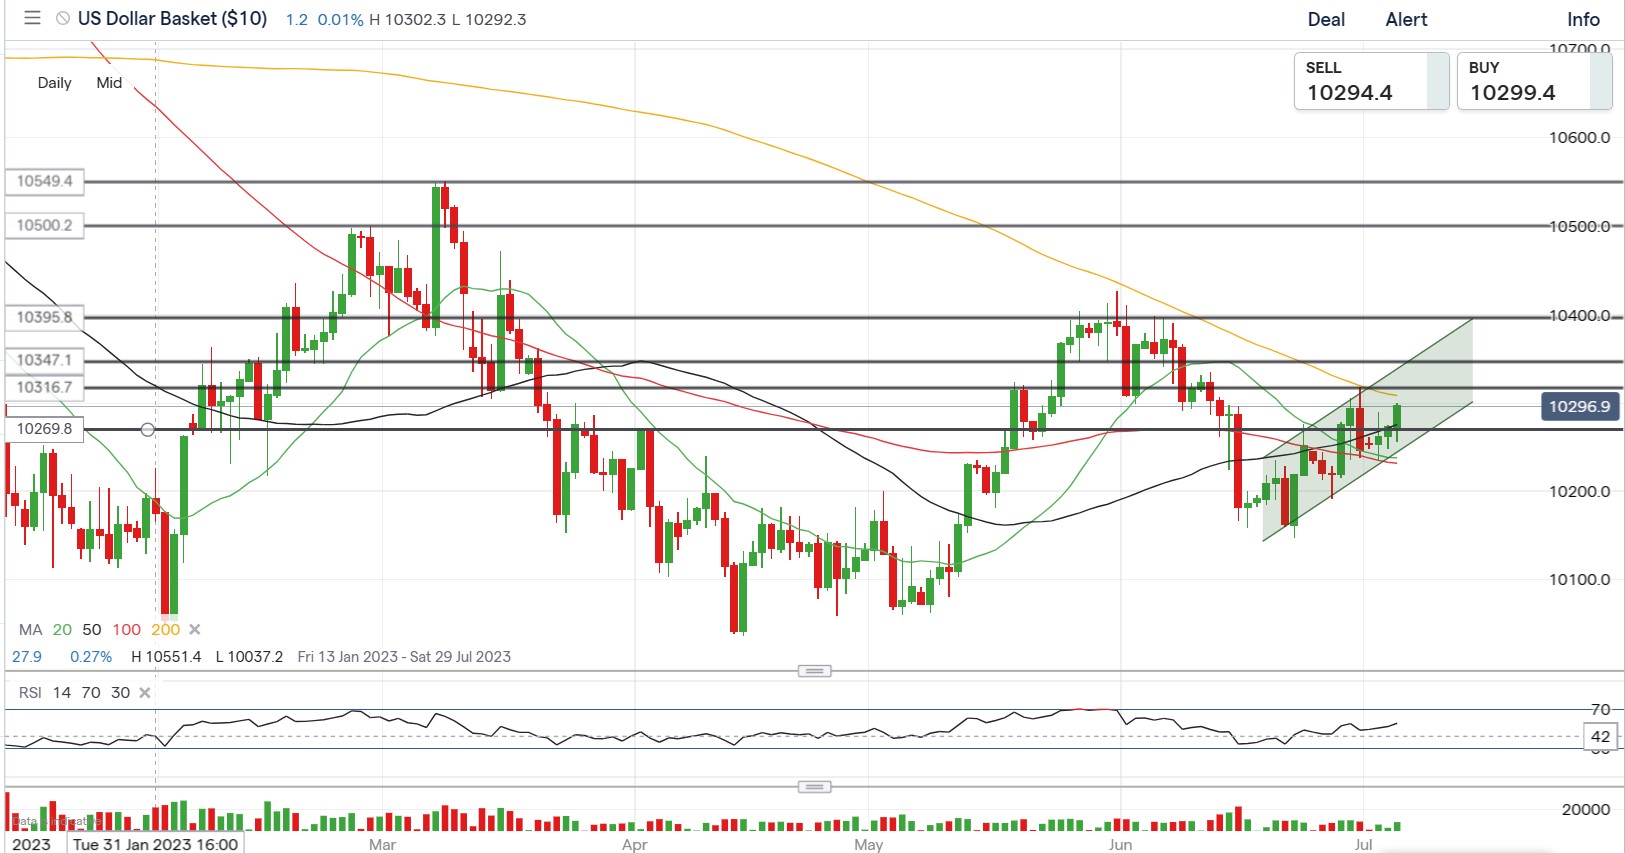
Based on the daily chart, the US dollar has been steadily rising over the past three weeks and has maintained its position above the 50-day moving average, around 102.69, which can be considered as short-term support. If the upcoming job reports exceed expectations, it is likely that market participants will adjust their expectations for Federal Reserve rate hikes upward, potentially pushing the US dollar to continue challenging the 103 level. However, if the June non-farm payroll data reverses the upward trend of the past three months, the US dollar index may find support around its 20-day moving average, near 102.3.
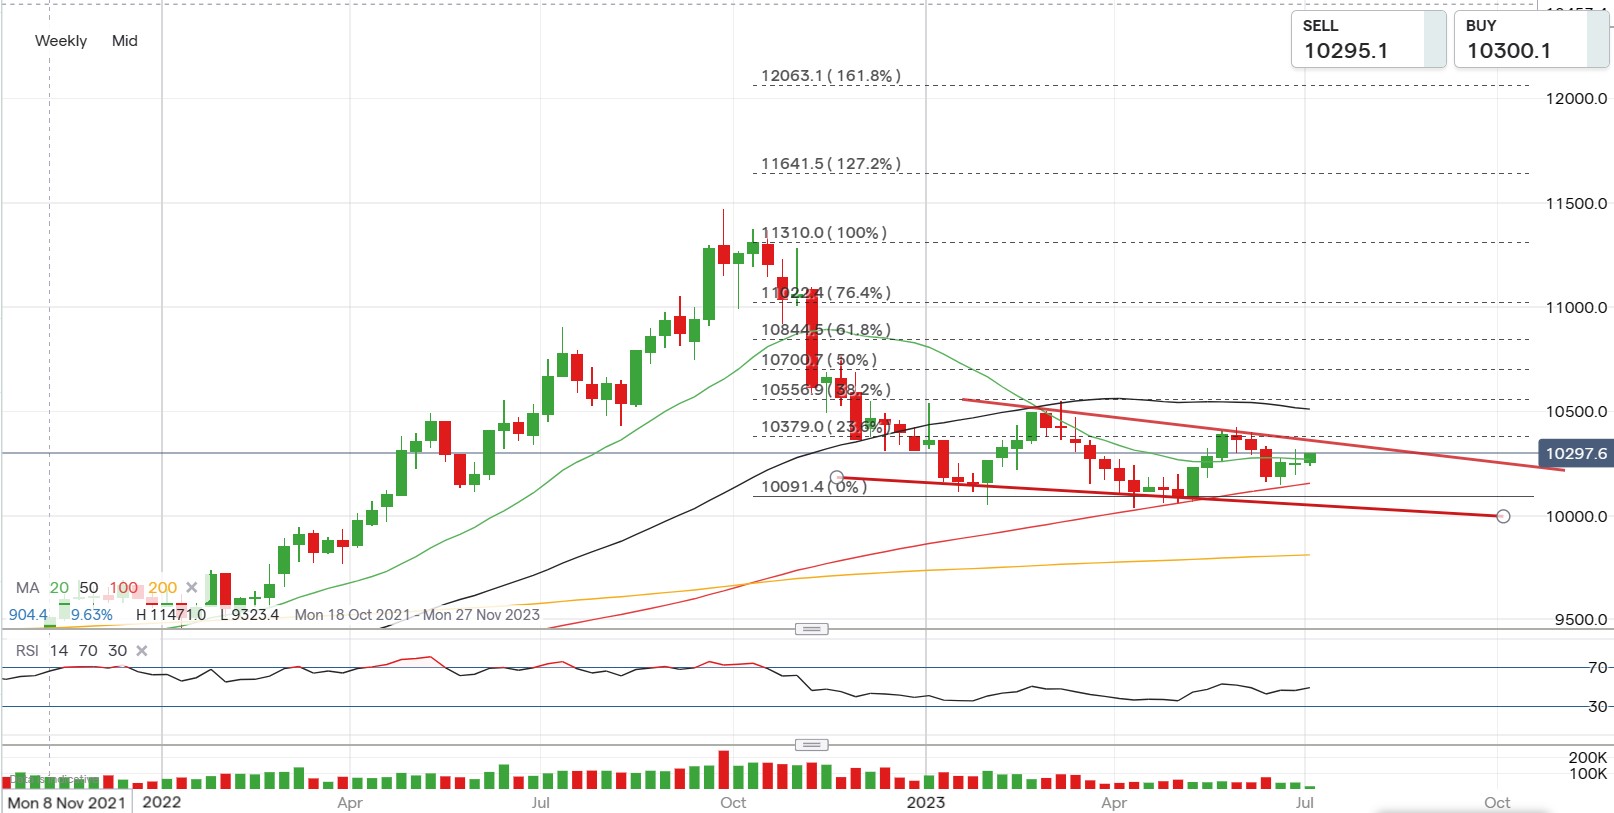
Looking at the weekly chart, despite the recent strength of the US dollar, it is evident that its upward momentum is relatively weaker compared to the earlier surge at the beginning of the year. Therefore, in the long term, even if the US dollar continues to rise following this week's data, it will likely encounter significant challenges as it approaches the high point reached in May.


0 Comments
Recommended Comments
There are no comments to display.
Create an account or sign in to comment
You need to be a member in order to leave a comment
Create an account
Sign up for a new account in our community. It's easy!
Register a new accountSign in
Already have an account? Sign in here.
Sign In Now