Asia on a cautious tone, following Wall Street’s reversal last Friday: Nasdaq 100, USD/JPY, AUD/USD

Entry posted by KoketsoIG in Analyst piece
514 views
An initial move higher in Wall Street last Friday eventually faded into the close, as market participants took the opportunity for further profit-taking into the seasonally weaker month of August.

Market Recap
An initial move higher in Wall Street last Friday eventually faded into the close (DJIA -0.43%; S&P 500 -0.53%; Nasdaq -0.36%), as market participants took the opportunity for further profit-taking into the seasonally weaker month of August.
The focus was on the US July non-farm payroll report, which saw a miss in job addition for the second straight month (187,000 vs 200,000 consensus) but nevertheless, a downtick in unemployment rate (3.5% vs 3.6% consensus) and pull-ahead in wage growth (4.4% YoY vs 4.2% consensus) still denote signs of a tight labour market.
The data may support soft landing hopes, but persistent wage pressures seem to suggest keeping an eye on inflation risks ahead, alongside recent upmove in commodities prices over the past month. For now, market participants will want to see more evidence of inflation back on the rise to price for additional tightening, which will leave all eyes on the US Consumer Price Index (CPI) data this week.
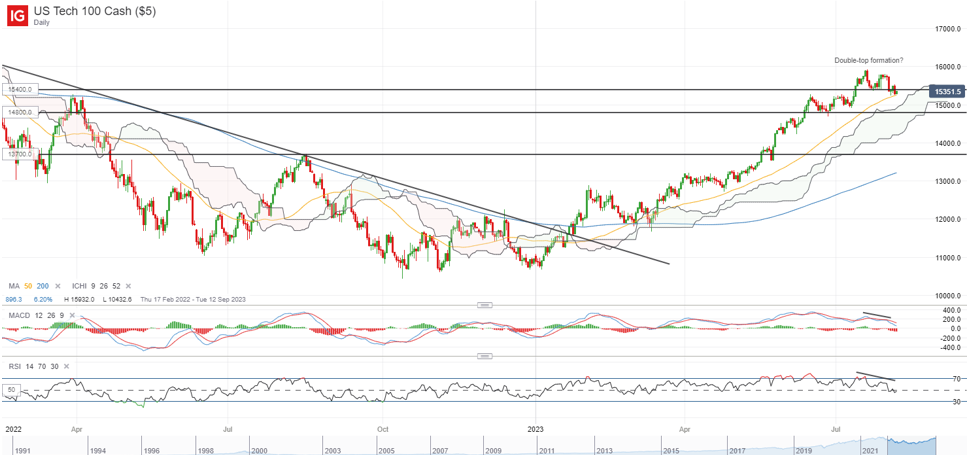
US Treasury yields reacted to the downside, which put the US dollar on a slight breather (-0.3%) following its recent rally. For the Nasdaq 100, the index continues to hover below its 15,400 level, which serves as a neckline for a near-term double-top formation. An attempt to reclaim the level last Friday was met with some resistance, which still denotes near-term exhaustion to its recent rally. Further downside may place the 14,800 level on watch next, where the upper edge of its Ichimoku cloud support stands.
Asia Open
Asian stocks look set for a weak open, with Nikkei -0.67%, ASX-0.03% and KOSPI -0.06% at the time of writing, largely displaying a cautious tone following last Friday’s reversal on Wall Street. The release of the Bank of Japan (BoJ)’s summary of opinions this morning revealed wide consensus for its yield curve control policy to be more flexible, which saw some firming in the Japanese Yen upon its release.
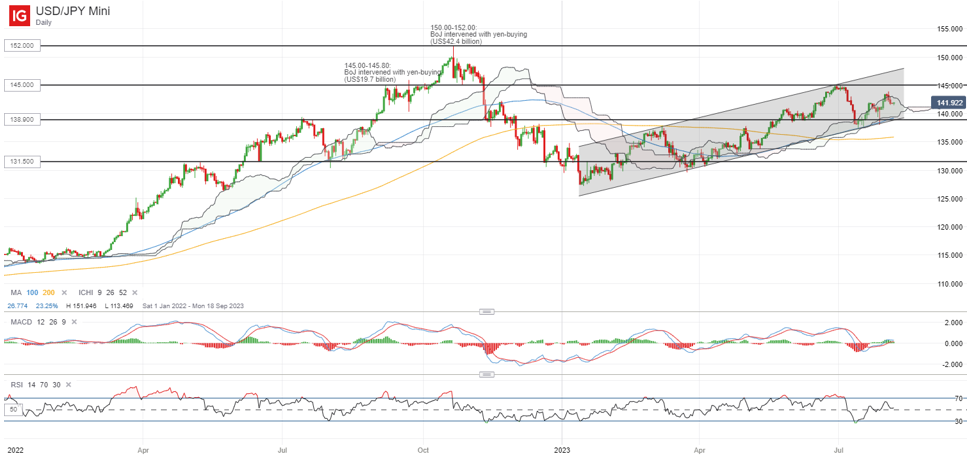
Nevertheless, the bias for the USD/JPY still seems to lean on the upside for now, having defended the lower trendline of its ascending channel pattern lately with a bullish pin bar formation. The 138.90 level could be a crucial support confluence to hold for the pair, where its 100-day moving average (MA) coincides with the lower channel trendline and the lower edge of its Ichimoku cloud support. For now, its relative strength index (RSI) continues to trend above the 50 level, which puts buyers in control.
The 145.00 will remain an immediate resistance to overcome ahead, having seen a sell-off in early-July this year from renewed speculations around currency intervention. Heading towards the 145.00-145.80 level, where previous intervention efforts were delivered back in September 2022, could potentially trigger some jawboning from authorities once more, which may reignite some resistance for the pair.
On the watchlist: AUD/USD moves below key support
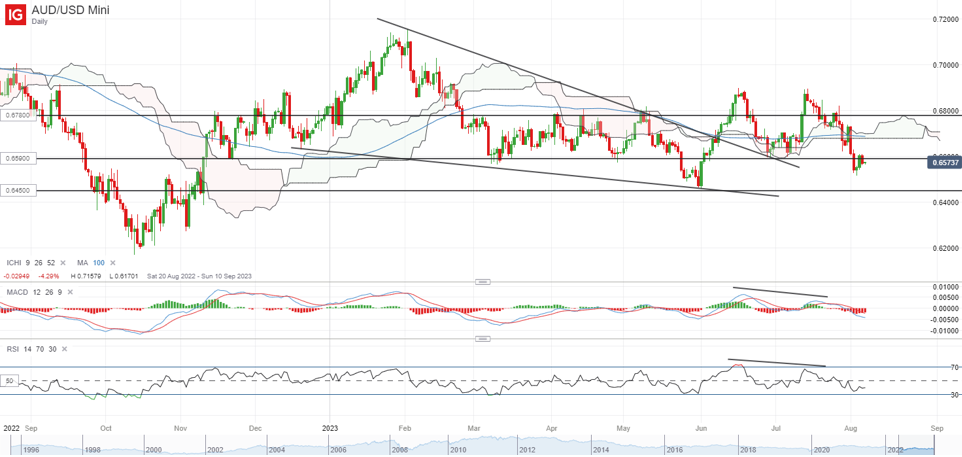
A rate hold from the Reserve Bank of Australia (RBA) last week, alongside a more subdued risk environment and mixed economic data out of China, has prompted the AUD/USD to fall below its horizontal support at the 0.659 level. This seems to point towards a breakdown of a near-term double-top formation, with a retest of the 0.659 level last Friday met with a bearish rejection.
Its moving average convergence/divergence (MACD) has crossed back below the zero mark, with its RSI sliding further below the 50 level, which seems to put sellers in control for now. Further downside may leave its year-to-date low at the 0.645 level on watch next, while on the other hand buyers may have to reclaim the 0.659 level to support a move back towards the 0.678 level.
Friday: DJIA -0.43%; S&P 500 -0.53%; Nasdaq -0.36%, DAX +0.37%, FTSE +0.47%


0 Comments
Recommended Comments
There are no comments to display.
Create an account or sign in to comment
You need to be a member in order to leave a comment
Create an account
Sign up for a new account in our community. It's easy!
Register a new accountSign in
Already have an account? Sign in here.
Sign In Now