Alibaba Earnings Preview: Is BABA 2.0 a Better Version?

Entry posted by AshishIG in Analyst article
857 views
Alibaba Group will report its June quarter results on August 10th. This to-be-reported quarter holds immense significance for the company, as two major changes have the potential to usher an entirely new era for BABA.

Source: Bloomberg
Alibaba Group is poised to take center stage as it unveils its June quarter 2023 results on August 10th. This to-be-reported quarter holds immense significance for the company, as two major changes announced during this period have the potential to propel the Chinese e-commerce powerhouse into an entirely new era.
Alibaba Earnings Date
Alibaba Group Will Announce June Quarter 2023 Results on August 10, 2023.
Alibaba Earnings Expectations
EPS: CNY14.46 (52% increase QoQ)
Revenue: 224.91B (7% increase QoQ)
Alibaba Earnings Key Focus
Revenue and profitability
According to its most recent quarterly report, while BABA experienced substantial growth across various business categories, its primary revenue generator, "China commerce," which contributes 65% of the group's total income, witnessed an unexpected 3% year-over-year (YOY) drop. This decline is particularly noteworthy worrying considering that the March quarter report encompasses the first full three months since China fully reopened from its stringent COVID restrictions.
As such, one of the primary focal points for BABA's Q2 earnings will be the e-commerce giant's efforts to reverse the downtrend in the domestic commerce segment, especially in light of China's current underwhelming economic recovery journey.
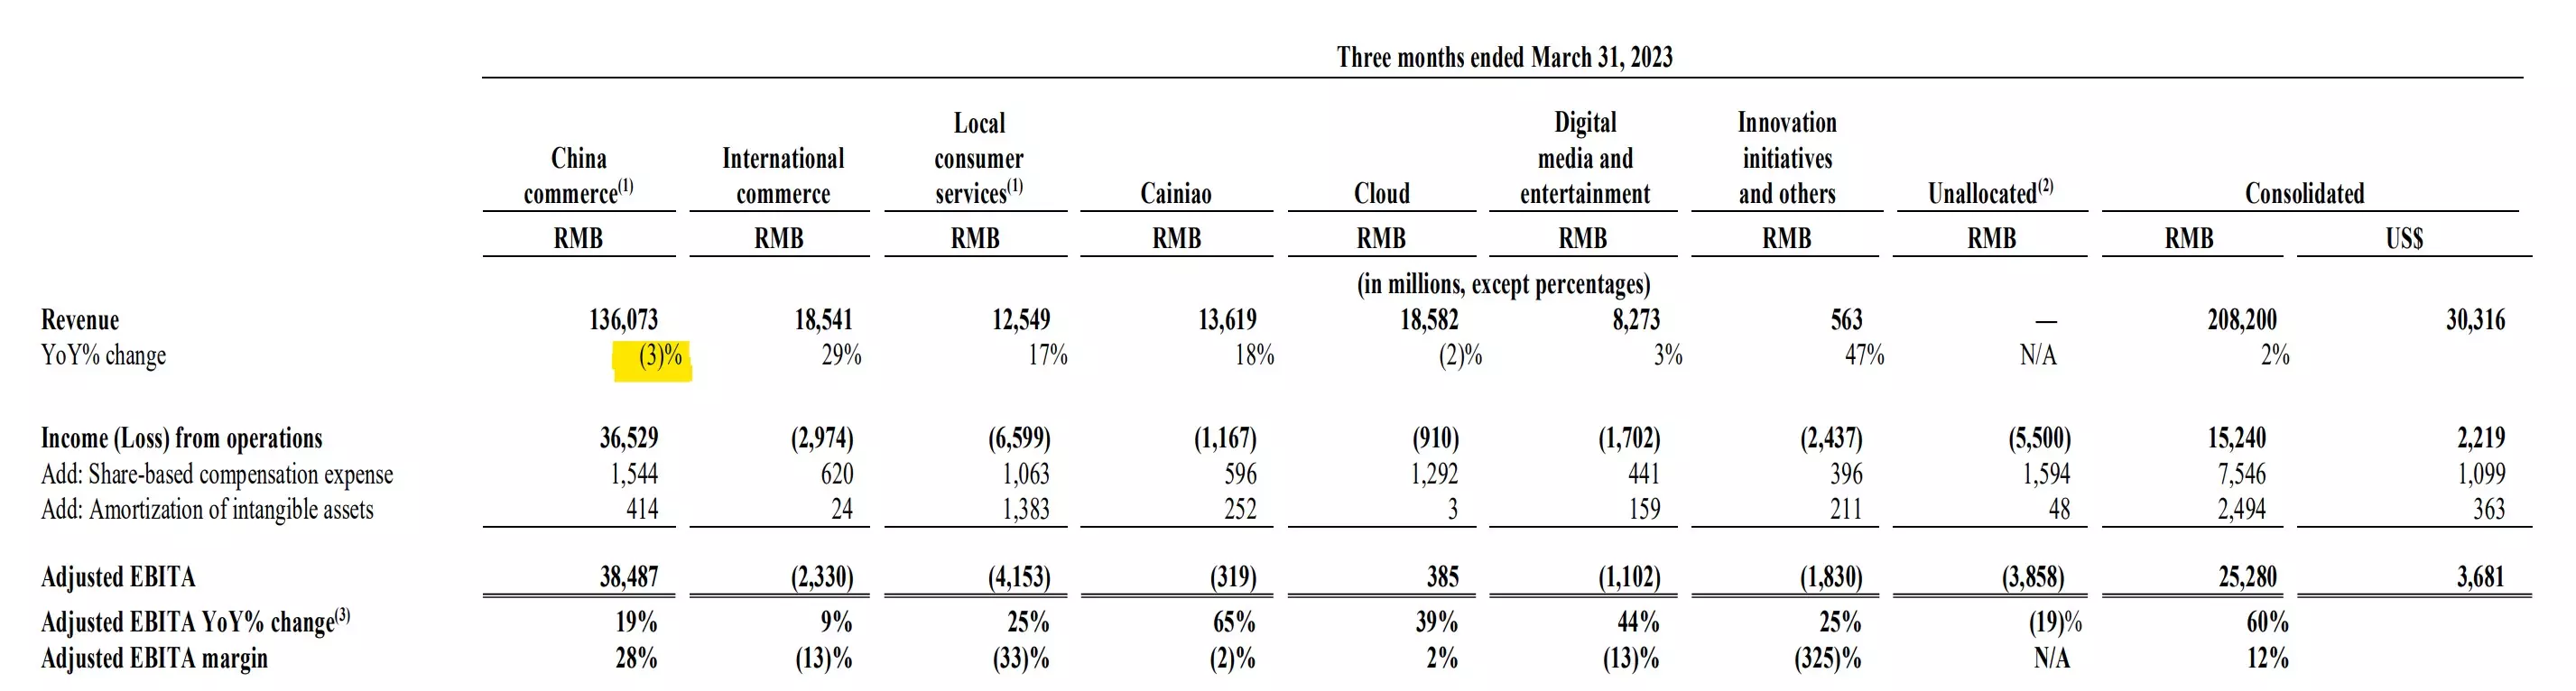
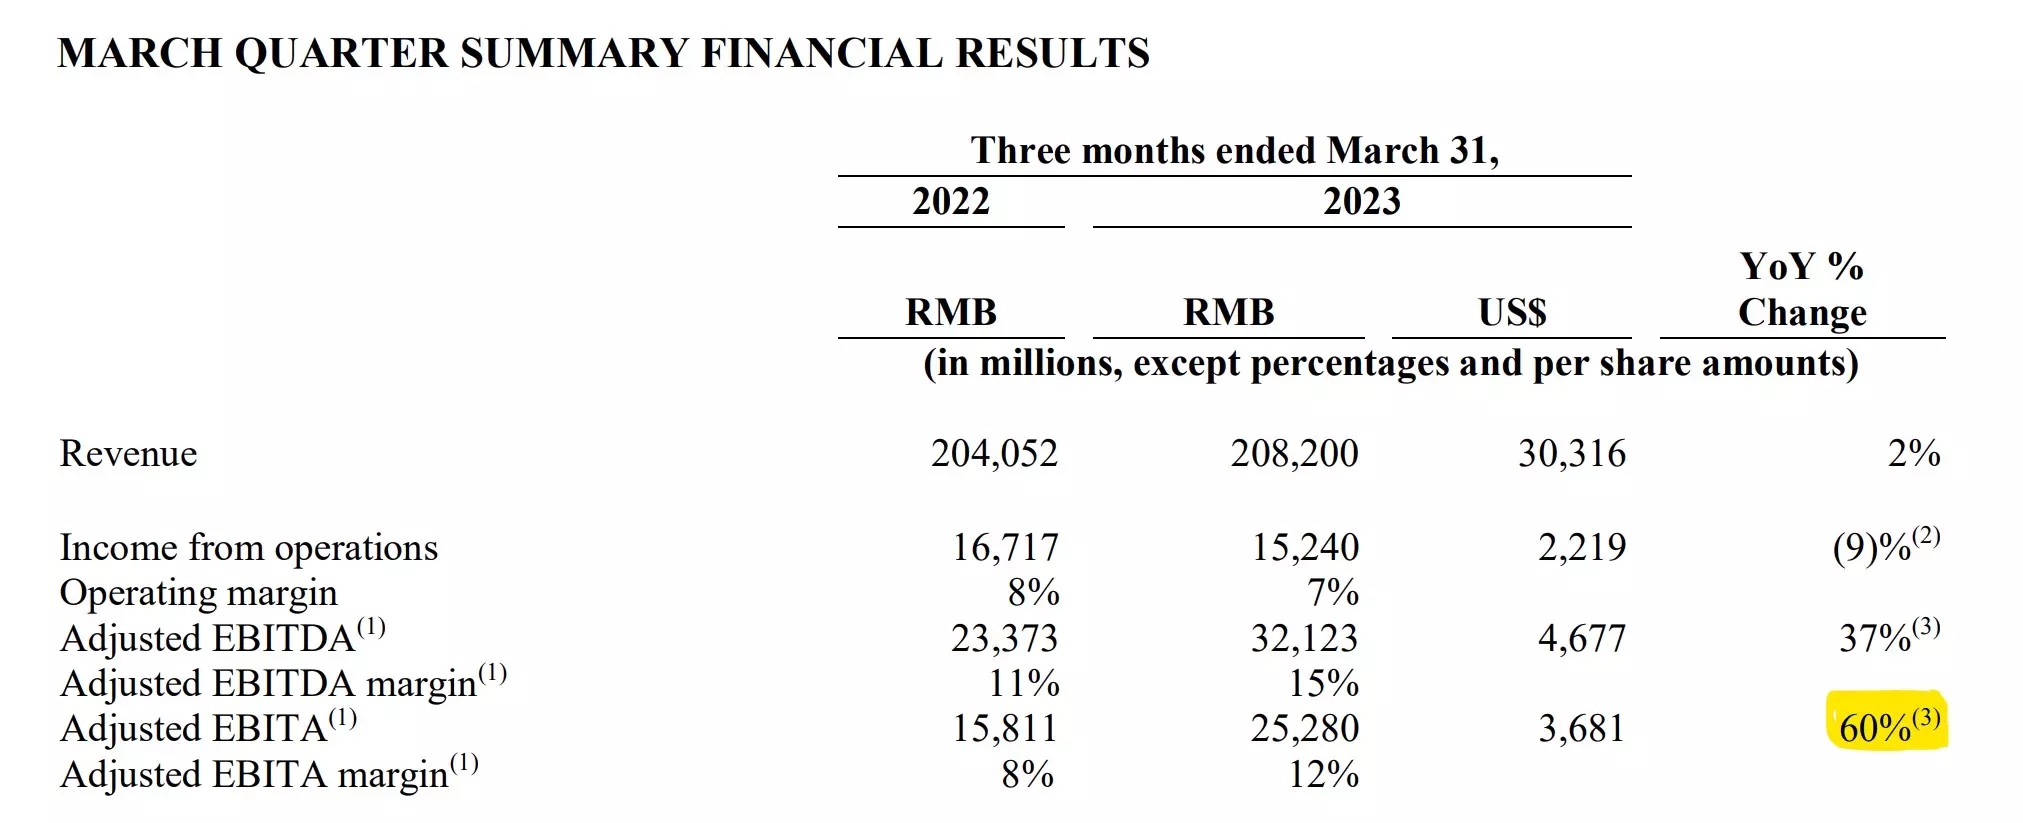
Another compelling factor to closely monitor is the profitability. In the preceding quarter, Alibaba delivered a remarkable 60% year-over-year (YOY) growth in its adjusted EBITA. This accomplishment marks the company's successful return to a double-digit EBITDA margin, after dipping to only 8% in the previous year.
How is BABA 2.0?
In the first half of 2023, Alibaba made several significant announcements that captured global headlines. On March 28th, the company confirmed its strategic move to spin off its business units into six self-operated companies, including the intention to take the cloud intelligence and logistics division public within the next 12 to 18 months. This "biggest restructuring plan in the company's history" led to a 15% surge in BABA’s stock price, driven by the anticipation of enhanced company value and potential growth.
Another major milestone occurred in late June when Alibaba underwent a significant leadership transition. This reshuffling involved the replacement of both the Chairman of the Board and the CEO positions. Simultaneously, China's central bank imposed a substantial fine of 7.12 billion yuan (approx $985 million) on Ant Group, an affiliate of Alibaba. This monster-sized fine was widely interpreted as the conclusion of the Chinese government's two-year-long clampdown on the tech sector.
All these indicators appear to suggest that an exciting "new era" for BABA is on the horizon. However, whether the bearish thesis against Alibaba can be put aside remains a matter of debate, and it is too early to draw definitive conclusions. Nonetheless, the upcoming earnings report has the potential to shed more light on the company's fresh chapter.
Alibaba Technical Analysis
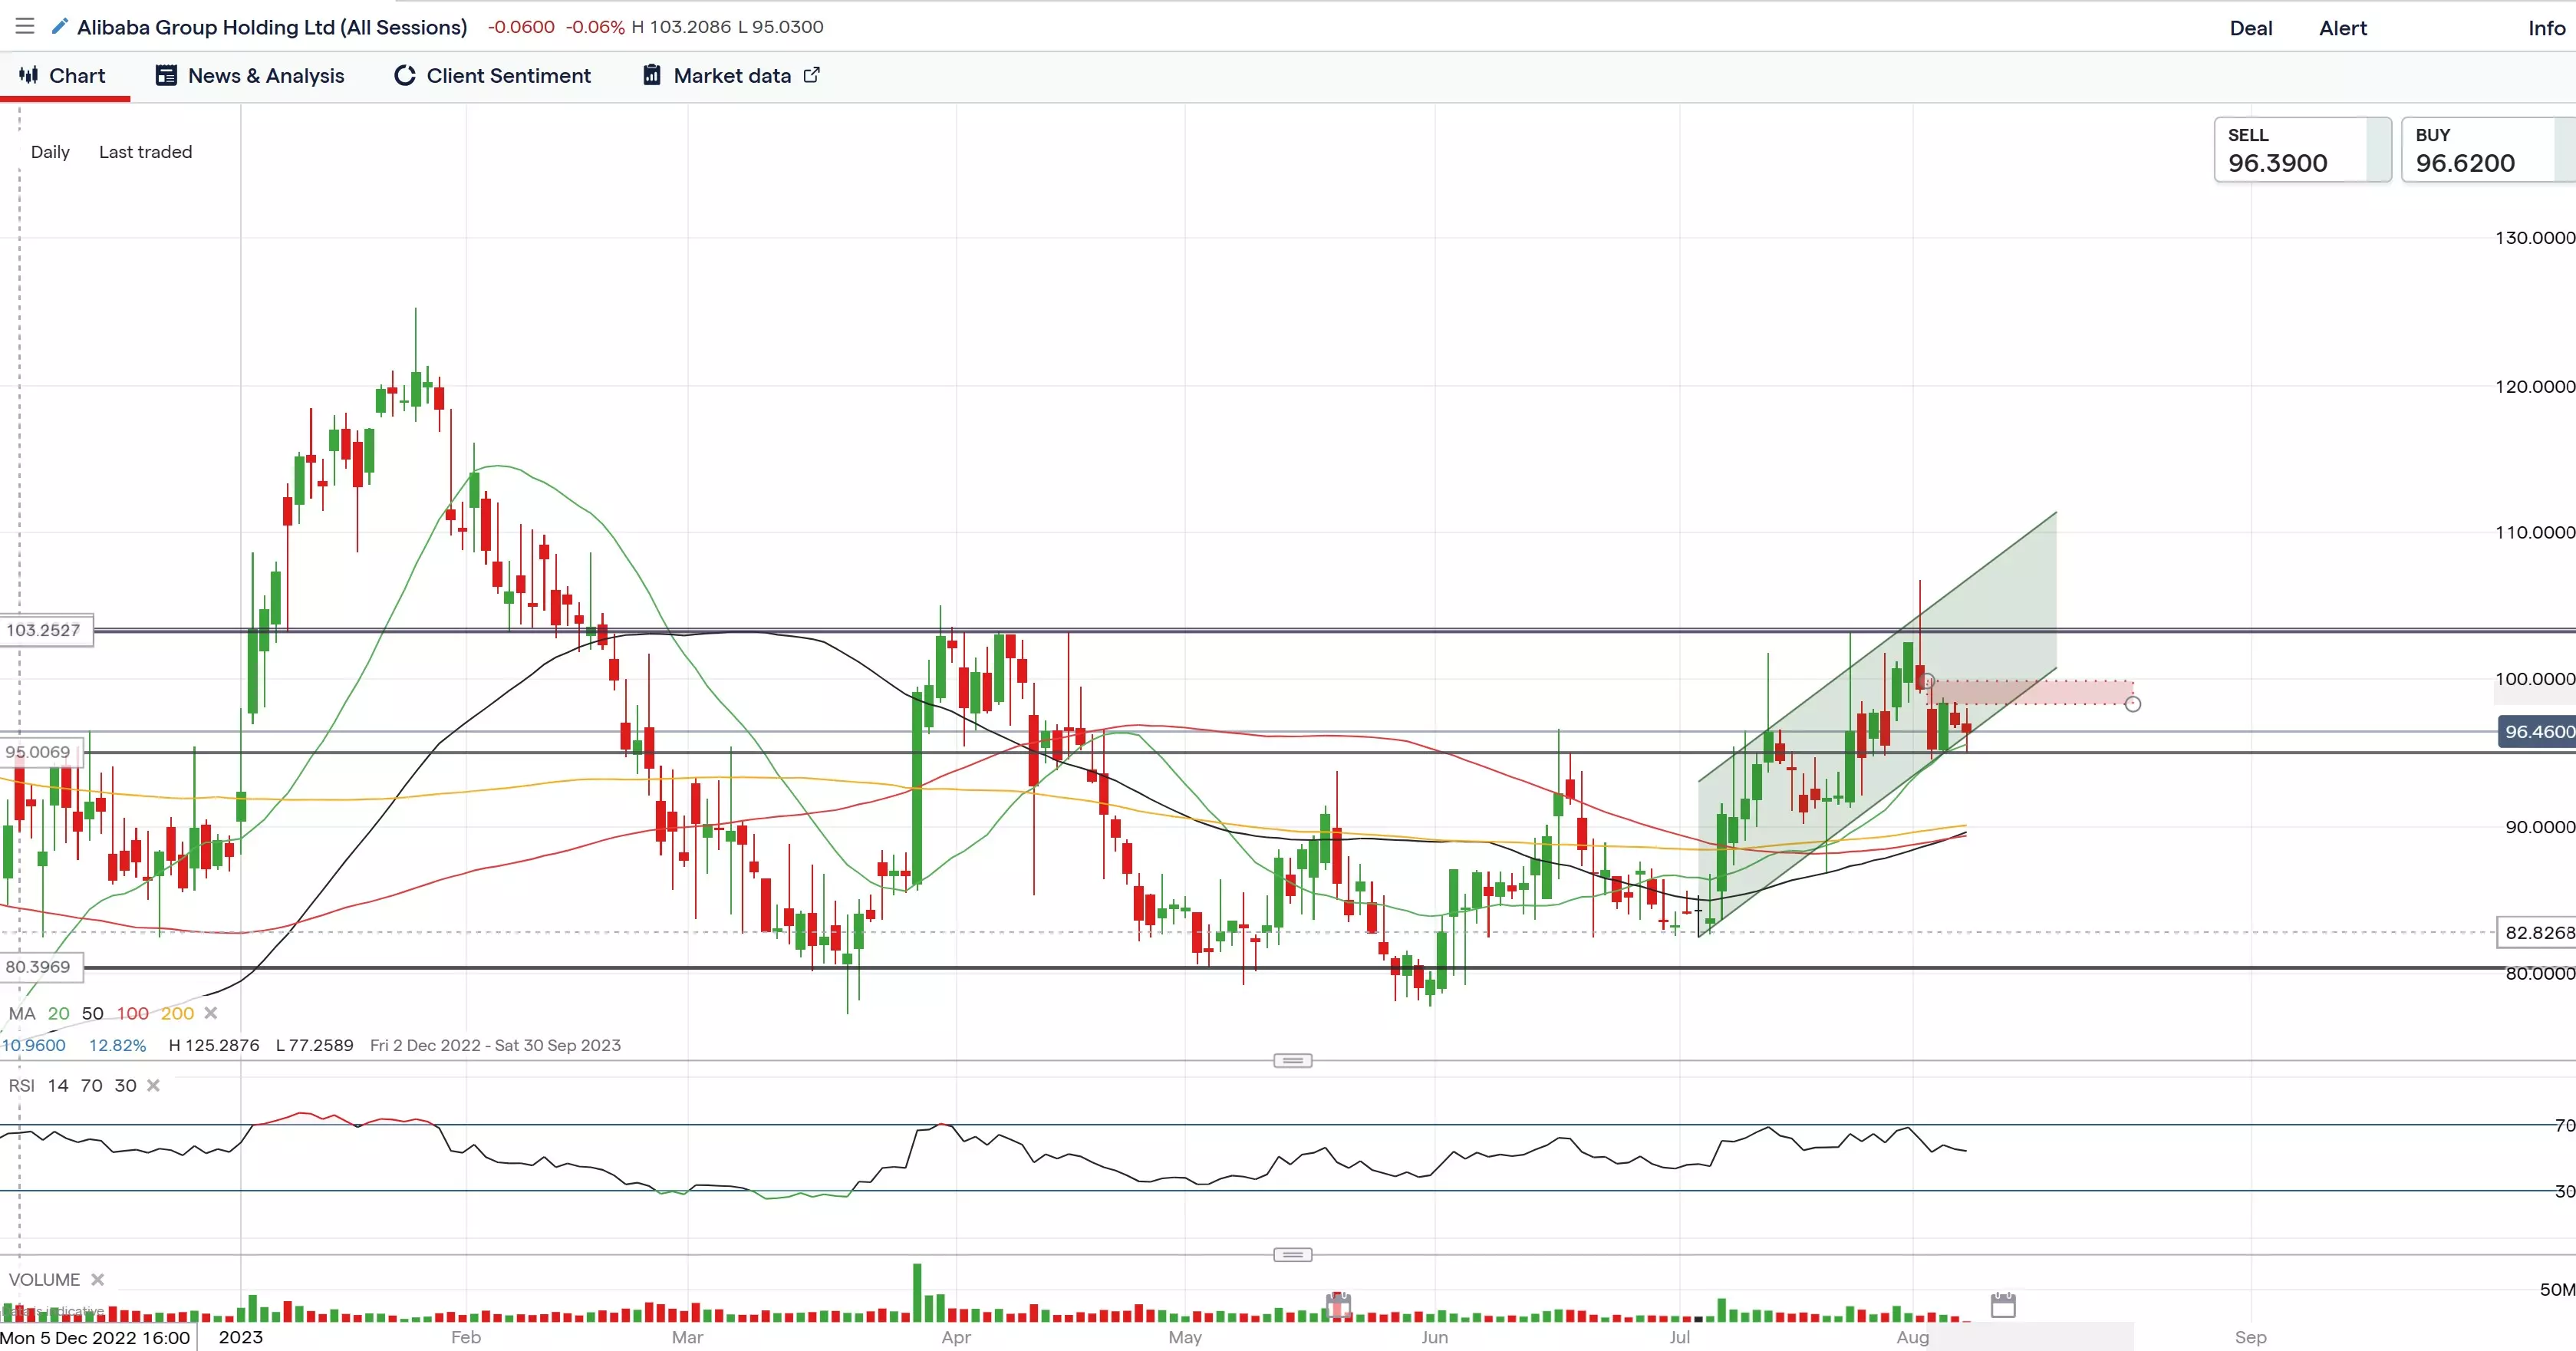
Looking at BABA's daily chart, it's worth noting that the price action has shown strong momentum, forming an ascending trajectory since early July, despite falling short of retesting the April peak at $103.
However, as August began, the price slipped below the psychologically significant level of $100 and has been trending towards the lower boundary of this upward trajectory in recent sessions. This situation could indicate a potential bear-biased turn coinciding with the release of earnings.
In the event that the month-long trend line is breached following a disappointing result, the December peak at $95 could come into play as an initial support. Further down the line, the $90 region assumes a critical role as a level of support, as it currently intersects with the 50, 100, and 200-day Simple Moving Averages (SMAs).
Conversely, on the positive side, before BABA’s stock price rechallenging its recent four-month peak at $103, it is imperative for the price to overcome the price gap between $98 and $99, which stands as an immediate hurdle.
-
 1
1


0 Comments
Recommended Comments
There are no comments to display.
Create an account or sign in to comment
You need to be a member in order to leave a comment
Create an account
Sign up for a new account in our community. It's easy!
Register a new accountSign in
Already have an account? Sign in here.
Sign In Now