Hawkish tilt in Fed minutes, while trade data in Asia weakened: Gold, USD/SGD, US dollar

Entry posted by AshishIG in Analyst article
431 views
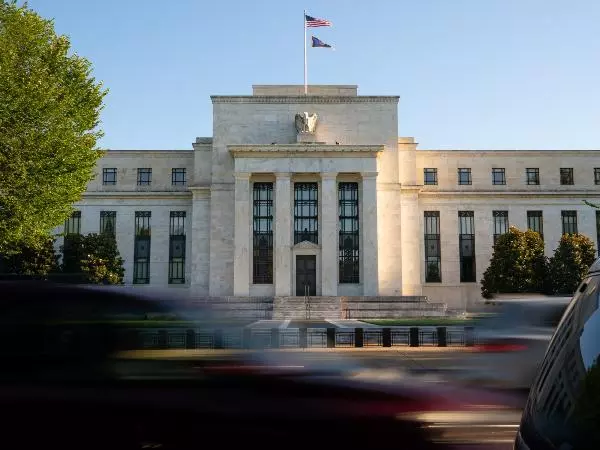
It was another down day in Wall Street, as statements from the FOMC minutes did not reflect the level of unity among policymakers to pause rates as what was initially expected.
Source: Bloomberg
Market Recap
It was another down day in Wall Street, as statements from the Federal Open Market Committee (FOMC) minutes did not reflect the level of unity among policymakers to pause rates as what was initially expected. Particularly, the key takeaway that “most participants continued to see significant upside risks to inflation, which could require further tightening of monetary policy” was somewhat perceived to carry a hawkish tilt.
The Federal Reserve (Fed) Bank funds futures still showed firm expectations for a rate pause in September (88% probability) but doubts have surfaced for the November meeting. A 35% probability of a November hike is currently priced, up from the 28% a week ago. Given that the Fed reiterated its data-dependent stance in the minutes, it may still have to take a series of upside surprises in inflation to anchor down views of additional tightening, but for now, the minutes were tapped on as a catalyst for the risk rally to further unwind, alongside jitters in the Chinese space.
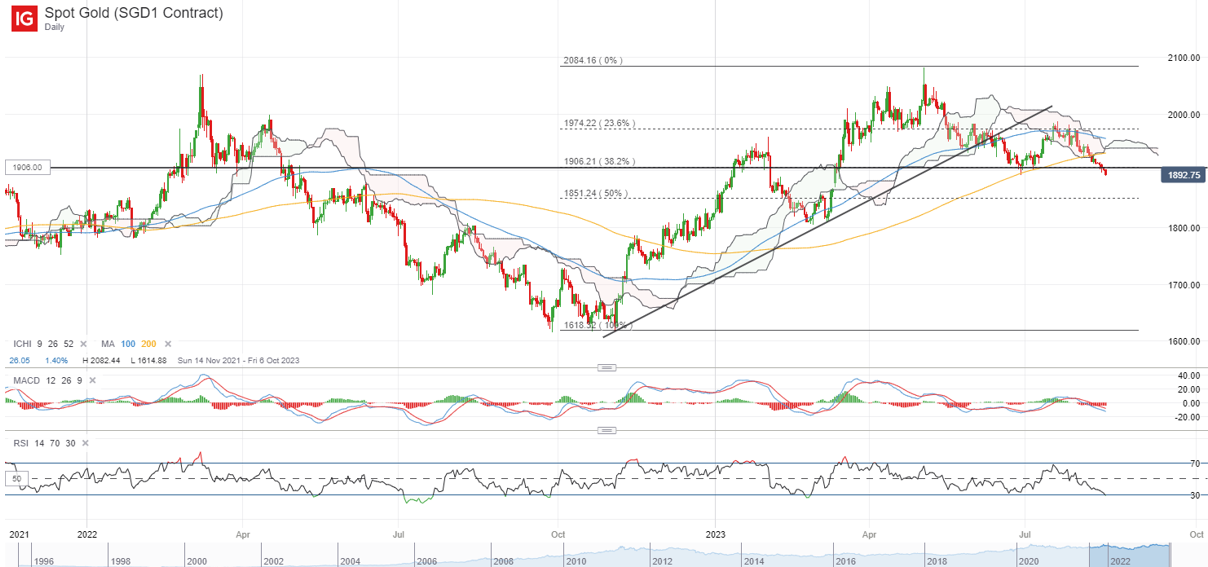
US Treasury yields largely held firm, with the two-year yields hovering at the 5% mark as a reflection for a high-for-longer rate outlook while the 10-year yields head for its October 2022 peak. The US dollar firmed, crossing its 200-day moving average (MA) for the first time since November 2022. That kept the pressure on gold prices overnight (-0.5%), which touches a new low since March this year. Its weekly relative strength index (RSI) has headed further below the 50 level, with further downside potentially leaving the US$1,850 level on watch next.
Source: IG charts
Asia Open
Asian stocks look set for a negative open, with Nikkei -0.88%, ASX -0.90% and KOSPI -1.21% at the time of writing. Weak showing in trade data across the region continue to point to the prevailing headwinds in global demand, partly weighed by the low-for-longer growth conditions in China. Japan’s exports registered its first year-on-year decline (-0.3%) in 2.5 years and along with a lower-than-expected read in machinery orders for June (-5.8% versus -5.5% consensus), that may support the Bank of Japan (BoJ) on its more gradual path of policy normalisation.
Similarly, Singapore’s non-oil domestic exports (NODX) for July tumbled, with a larger 20.2% contraction year-on-year way underperforming the 14.4% contraction expected. Given the headwinds to China’s growth conditions with property sector risks likely to drag for longer, while spillover default risks have reached the shadow banking sector, there are rising doubts on the country’s 5% growth target for this year. The current bias is that the worst is yet to come for China, with a more subdued growth outlook across the export-dependent region likely to stay for the rest of the year.
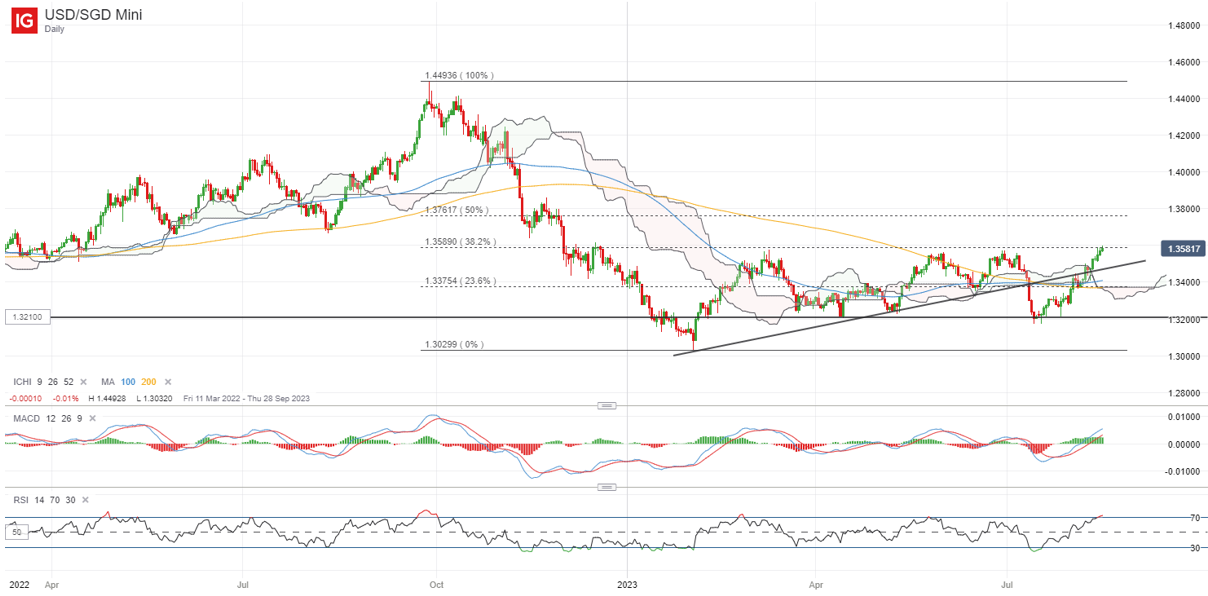
A firmer US dollar overnight has pushed the USD/SGD to a new year-to-date high. The daily RSI in overbought territory may call for some cooling, but given that the pair has reclaimed its 200-day MA for the first time since November 2022, buyers still remain in greater control. The pair is heading past its 1.360 level of resistance this morning, where a 38.2% Fibonacci retracement level stands from its September 2022 peak to February 2023 bottom. Further upside may potentially pave the way to retest the 1.376 level next.
Source: IG charts
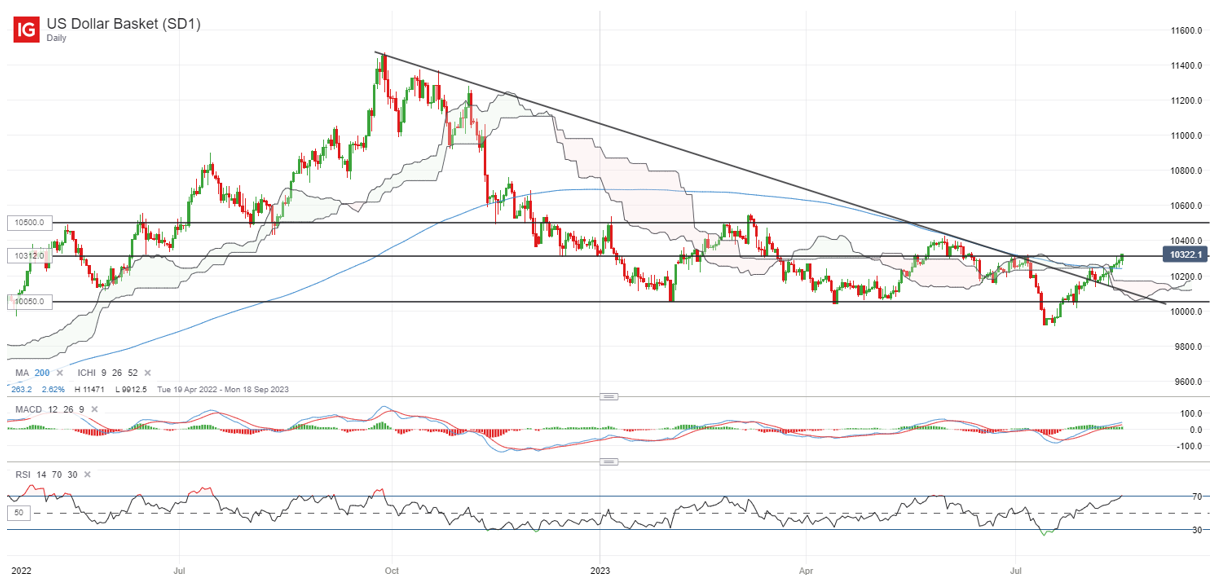
On the watchlist: US dollar back above its 200-day MA for first time since November 2022
The 4.2% gain in the US dollar over the past month has seen the index overcome several key resistance in the likes of a downward trendline in place since September 2022, along with its 200-day MA. Sustaining above the MA-line will be key ahead. For now, the US dollar is back at its 103.12 level, where it faced strong resistance from the previous Fed minutes release. Reclaiming the 103.12 level may potentially pave the way to retest the 105.00 level next, as its weekly RSI attempts to head above the key 50 level as a reflection of buyers in greater control.
Source: IG charts
Wednesday: DJIA -0.52%; S&P 500 -0.76%; Nasdaq -1.15%, DAX +0.14%, FTSE -0.44%
-
 1
1


.jpeg.98f0cfe51803b4af23bc6b06b29ba6ff.jpeg)


0 Comments
Recommended Comments
There are no comments to display.
Create an account or sign in to comment
You need to be a member in order to leave a comment
Create an account
Sign up for a new account in our community. It's easy!
Register a new accountSign in
Already have an account? Sign in here.
Sign In Now