Gold Prices May Break 2021 Floor as Fed Policy Speculation Heats Up
GOLD PRICE OUTLOOK:
- Gold prices plunge as July’s US jobs data outperforms vs. expectations
- Fed stimulus withdrawal bets building with CPI, Jackson Hole in view
- Breaking 2021 floor might set the stage for testing the $1600/oz figure
Gold prices plunged after July’s stronger-than-expected US jobs report stoked Fed stimulus withdrawal bets. The US Dollar traded broadly higher and Treasury bond yields rose, tarnishing the appeal of the non-interest-bearing, perennially anti-fiat yellow metal.
The economy added 943k jobs last month, topping forecasts calling for a 870k increase. The unemployment rate sank to 5.4 percent having been penciled in at 5.7 percent. Wage growth accelerated to 4 percent on-year, whereas economists anticipated a rise of 3.8 percent.
The response from markets seemed unequivocal. The rate hike path implied in Fed Funds futures steepened following nearly a month of moderation. At least one 25bps rate hike is now baked in for 2022, with a further 50bps on the menu in 2023 and one more 25bps increase slated for 2024. A pause in 2025 is envisioned.
Traders have probably pulled forward the expected timeline for tapering QE asset purchases too. The Fed’s Jackson Hole symposium this month may emerge as the consensus venue to set the stage for this process if July’s US CPI data tops forecasts later this week. Core price growth is seen moderating from 4.5 to 4.3 percent
GOLD TECHNICAL ANALYSIS – READY TO BREAK 2021 FLOOR?
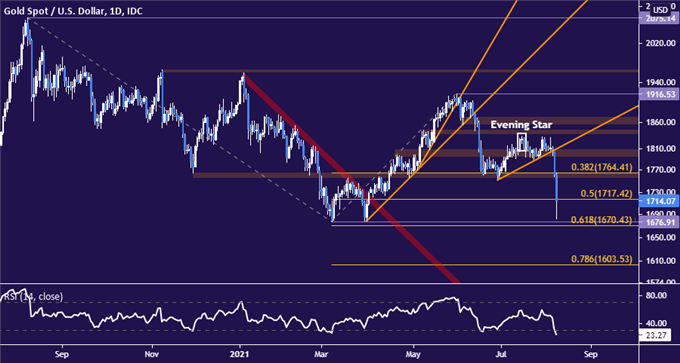
Gold prices made good on signs of topping identified three weeks agowith the appearance of a bearish Evening Star candlestick pattern.A secondary, lower high was carved out below resistance in the 1837.05-45.44 area before prices plunged through support.
Sellers are now testing the 50% Fibonacci expansion at 1717.42. Beyond that is the pivotal year-to-date floor at 1676.91, a barrier reinforced by the 61.8% Fib at 1670.43. A daily close below the latter level may set the stage for a challenge of the 78.6% expansion, which sites just a hair above the $1600/oz figure.
Immediate resistance is at 1764.41, the 38.2% Fib. Reversing back above that threshold may put bullion on a path to retesting the 1795.00-1808.40 inflection region.

Gold price chart created using TradingView
GOLD TRADING RESOURCES
- What is your trading personality? Take our quiz to find out
- See our guide to build confidence in your trading strategy
- Join a free live webinar and have your questions answered
Ilya Spivak, Head Strategist, APAC for DailyFX
09 August 2021
To contact Ilya, use @IlyaSpivak on Twitter


0 Comments
Recommended Comments
There are no comments to display.
Create an account or sign in to comment
You need to be a member in order to leave a comment
Create an account
Sign up for a new account in our community. It's easy!
Register a new accountSign in
Already have an account? Sign in here.
Sign In Now