Dollar Forecast Leans Further on NFP after ADP, Dow Quiet Hits Extreme
DOW, NFP, EURUSD, AUDUSD AND USDTRY TALKING POINTS
- Despite the long-awaited transition from August to September, the first day of trade in the new month didn’t bring a sudden resurgence of activity
- The US ADP private payrolls report and the employment component of the ISM’s manufacturing survey have leveraged the importance of Friday’s NFPs
- EURUSD and AUDUSD have put in for more convincing technical breaks, but what is the real capacity for this market to develop a genuine trend?
WE ARE ENTERING THE PULL OF HOLIDAY LIQUIDITY
The first full trading day of September is behind us, and clearly we have not made an immediate transition from Summer Doldrums to the seasonal volatility expected of the month. We have yet to pass the Rubicon of holiday trade and the urge to power down on speculative exposure is growing stronger in this very mature bull market. That said, the fundamental flash scheduled just before the weekend liquidity drain of the US NFPs (and ISM service sector report) poses a greater risk of twilight volatility – and traders are wary. In the meantime, uncertainty is palpable. The S&P 500 and Nasdaq 100 – leaders of the speculative charge even this week – have passed a second consecutive day of virtually no change. The most impressive anchor amongst the US indices though is from the blue-chip Dow Jones Industrial Average which has registered a 7-day ATR (measure of volatility that is at its lowest point since December 2019 while its trading range over the same time frame has dropped to a January 2nd, 2018 low. A breakout is due, but the question is whether it will happen this week or next.
Chart of Dow Jones Industrial Average with 50-Day SMA, 7-Day ATR and Range (Daily)
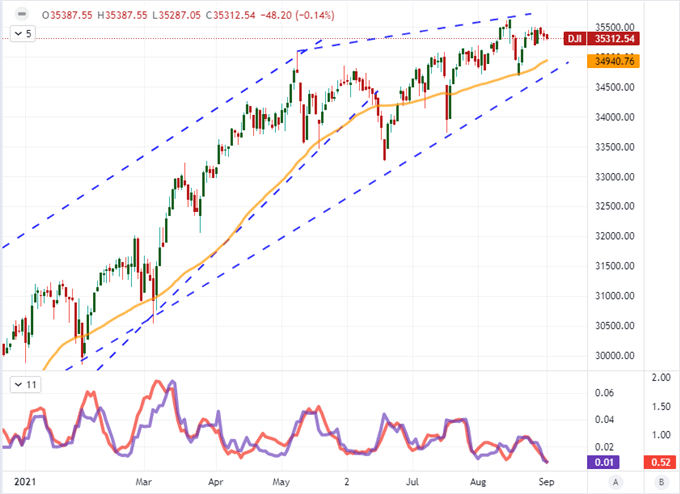
Chart Created on Tradingview Platform
If we go by the seasonal measures, a break looks far less likely to find its traction this week. Historically speaking, this week is one of the most restrictive of the active trading year as it represents the height of holiday season which tends to be observed by far more than the Americans and Canadians who actually have a market closure Monday. Below is the volume for the week before the Labor Day holiday (Mondays) the week of the Labor Day holiday and the 20-week average of volume up until that point for each year going back to 2000. There is materially lower volume the ‘week before’ than the average and typically the ‘week of’ which suggest momentum is difficult to muster. Of course, thin conditions can lead to disproportionately higher volatility.
Chart of S&P 500’s Volume in the Weeks Before and After the Labor Day Holiday Per Year
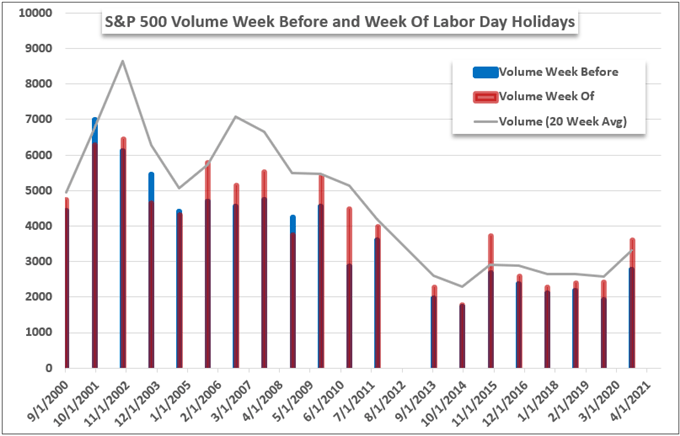
Chart Created by John Kicklighter with Data from Bloomberg
THE FUNDAMENTAL AMPLIFIERS FOR FRIDAY’S NFPS
There was already a healthy interest in Friday’s top event risk (US payrolls) even before this past session’s fundamental offerings. After last week’s charged PCE deflator and Fed Chairman Jerome Powell’s soft warning that a taper was coming, it was clear that attention would shift to the component of the central bank’s dual mandate which has been couched it concern: employment. Some of the central bank members have said that another strong jobs report could tip their support for a hike later this month, which are remarks that will not be readily missed by astute traders. With a consensus forecast for a 750,000 net increase on Friday, it would seem that the hawkish push would be well founded, but doubt is creeping back in after the ADP’s own significant shortfall – 374,000 jobs added versus 613,000 expected. This series has a history of deviating from the government’s own numbers, but that factoid is not likely to soothe any serious concerns.
Chart of Change in NFPs and ADP Private Payrolls with Difference Between Both (Monthly)
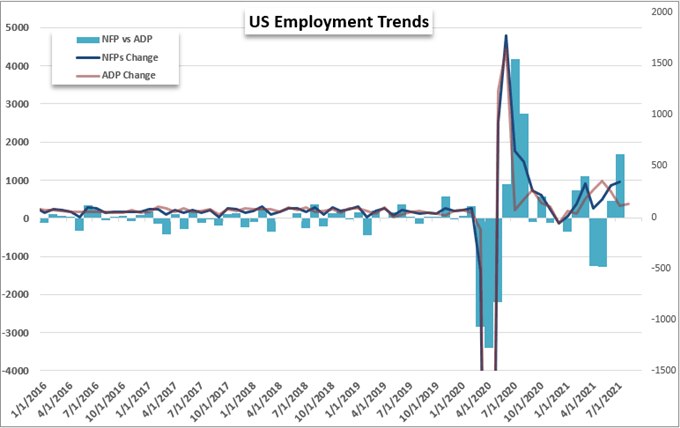
Chart Created by John Kicklighter with Data from BLS and ADP
Another important fundamental update from this past session that places further emphasis on the Friday payrolls was the ISM manufacturing activity report. While the headline measure reported an unexpected pickup from the previous month (59.5 to 59.9), the employment component unexpectedly dropped below the 50 threshold (a 49 print) which is indicative of net contraction. This is worrisome, but factory jobs are the minority in the United States. That will likely raise the profile of the other major US indicator due for release on Friday: the ISM service sector activity report.
Chart of S&P 500 Overlaid with ISM’s Manufacturing and Service Sector Activity Readings (Monthly)
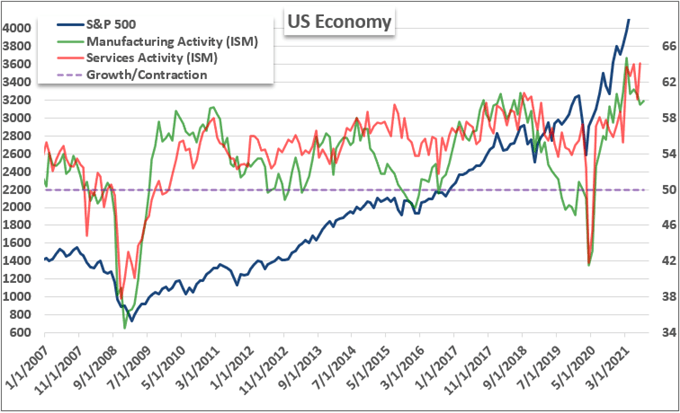
Chart Created by John Kicklighter with Data from ISM
THE DOLLAR IS MAKING SOME MOVES AND EM CURRENCIES HAVE WHIFFED
Despite the disappointing turn in employment conditions this past session, the Dollar did not gain serious traction in its stumble. That is surprising given that the DXY is on the action side of a bearish break. We can see that same technical setup in reverse through EURUSD where the break of the 50-day moving average is a continuation of the wedge clearance we registered at the beginning of the week. This does look like a break, but it doesn’t exactly match most Dollar pairs. There is certainly some Euro lift to this performance as the Eurozone unemployment rate eased this past session – after the region’s inflation rate hit a multi-decade high the day before that. Talk of an ECB taper conversation is gaining more traction in the market, but the ECB can simply sit quiet and let market activity bleed off naturally.
Chart of EURUSD with 50-Day SMA and Disparity Index 50-Day (Daily)
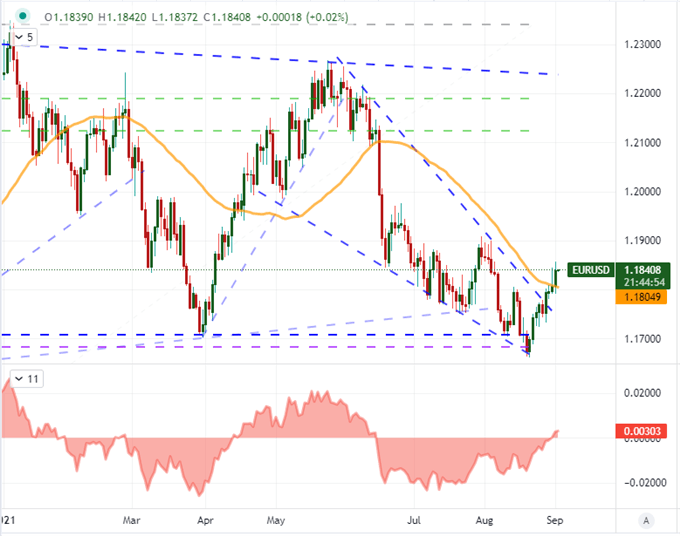
Chart Created on Tradingview Platform
Another outlier with impressive movement comes on behalf of AUDUSD. This pair would break its own bear trend to start the week in the move above 0.7300 but it hasn’t itself cleared the 50-day SMA. Looking out over the Aussie Dollar crosses, it seems pretty clear that this is where much of the traction is originating. After this past session’s Aussie GDP beat, it was reasonable to see a bullish charge. However, aside from the Australian trade data this morning (the US and Canada will release its own goods trade reports later), there isn’t much to fuel the fire. If this rally can continue – Aussie Dollar or AUDUSD – it would defy convention.
Chart of AUDUSD with 50-Day SMA and 50-Day Disparity Index (Daily)
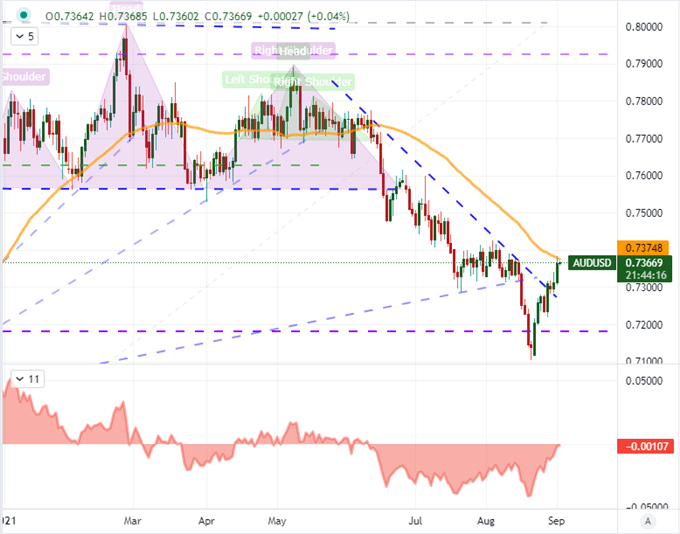
Chart Created on Tradingview Platform
Where I expected volatility to be heaviest this past session, there was the least traction to be found. The major emerging market currencies were saddled with a broad run of data this past session. PMI manufacturing activity reports were reported for China, Russia, India, South Korea, Brazil and Mexico. There were a few surprises among these numbers, but not much in the way of volatility to show for it. USDBRL was exhibiting particularly impressive restraint considering its own PMI slowed by 3.1 points while its 2Q GDP update showed a -0.1 percent contraction against expectations of a modest growth. That said, my attention was most sharply trained on USDTRY (US Dollar – Turkish Lira) with a strong technical reversal pattern coming to a head at 8.3000 support just as Turkey’s GDP was due. The 0.9 percent growth was materially slower than the 3.6 percent forecast, which would contradict the technical lean and ultimately reinforce the difficult market conditions. In these circumstances, the stars need to align for outperformance.
Chart of USDTRY with 50 and 200-Day SMAs (Daily)
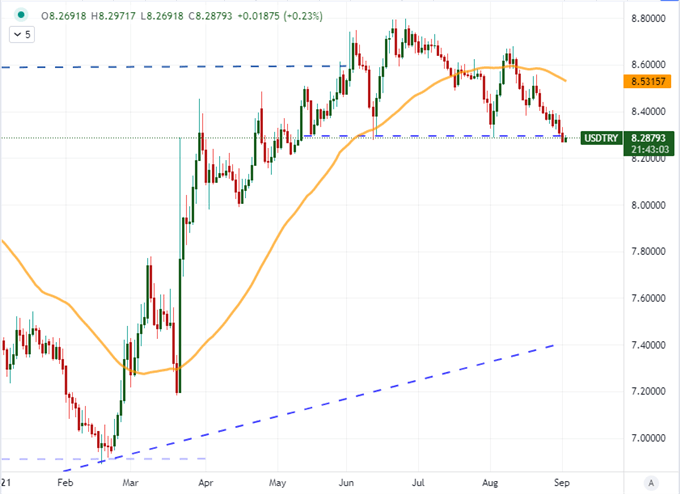
Chart Created on Tradingview Platform
By John Kicklighter, Chief Strategist, 2 September 2021. DailyFX


0 Comments
Recommended Comments
There are no comments to display.
Create an account or sign in to comment
You need to be a member in order to leave a comment
Create an account
Sign up for a new account in our community. It's easy!
Register a new accountSign in
Already have an account? Sign in here.
Sign In Now