Jump to content

US Dollar Drops, Gold Spikes Initially on NFP Headline Shock


MongiIG

1,723 views

USD, NFP Price Analysis & News

  • US NFP 235k vs Exp. 750k, Prior Reading Revised Higher
  • Unemployment Rate & Higher Than Expected Wage Growth Counters Headline
  • US Dollar Initial Drop Reverses

image.png

NFP Mixed as Headline Misses, Revision Downgraded, While Unemployment Rates Beats

A much weaker than expected NFP headline at 235k vs 750k, while the prior reading had been revised higher to 1053k from 943k. The unemployment rate fell 0.2ppts to 5.2% matching expectations with the labour force participation rate remaining unchanged at 61.7%. Elsewhere, average earnings beat expectations on both the monthly and yearly rate. As such, while the headline is somewhat of a shocker, markets had been positioned for soft report given the weaker ADP and contraction in ISM employment index, while in terms of the details, they are relatively firm, making for an overall mixed report.

USD Drops and Gold Pops

In reaction to the headline, the USD came under immediate pressure breaking below the 92.00 handle alongside yields, while the gold rose to its best levels of the day to hit a high of 1829. However, given the details are relatively firm than what the shocking headline would suggest, the market reaction has reversed back to pre-announced levels. This data is unlikely to notably alter the Fed’s tapering timeline given that Powell’s JH speech had essentially hinted that September would be too soon for an announcement.

Find Out More About Non-Farm Payrolls and How to Trade it

DATA OVERVIEW: DailyFX Economic Calendar
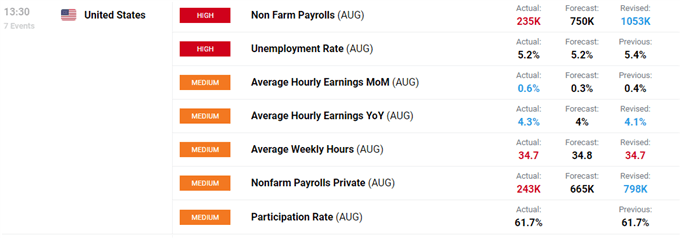
US Dollar Drops, Gold Spikes Initially on NFP Headline Shock

Source: DailyFX


USD, Gold, Rates Reaction to NFP: Intra-day Time Frame
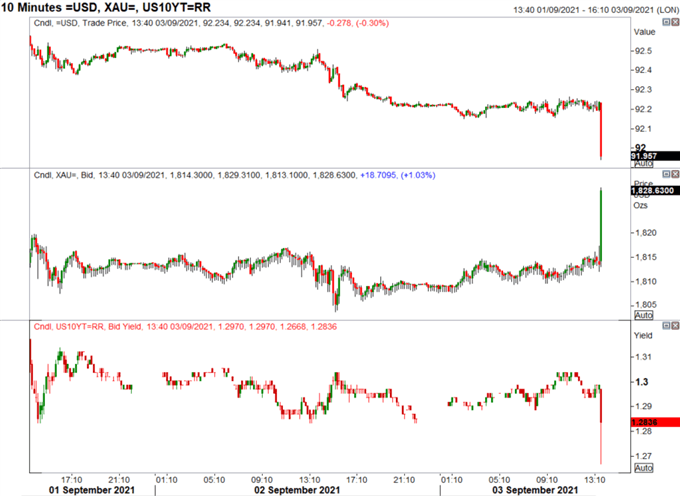
US Dollar Drops, Gold Spikes Initially on NFP Headline Shock

Source: Refinitiv


By DailyFX Research Team, 3 September 2021.

0 Comments


Recommended Comments

There are no comments to display.

Create an account or sign in to comment

You need to be a member in order to leave a comment

Create an account

Sign up for a new account in our community. It's easy!

Register a new account

Sign in

Already have an account? Sign in here.

Sign In Now
  • Blog Statistics

    • Total Blogs
      3
    • Total Entries
      2,821
  • Latest Forum Topics

  • Our picks

    • Are these the best AI stocks to watch in May 2024?
      Microsoft, Apple, Nvidia, Amazon and Meta could be the best AI stocks to watch next month. These stocks are the largest AI stocks in the US based on market capitalisation.
    • Natural Gas Commodity Elliottwave Technical Analysis
      Natural Gas


      Mode - Impulsive 


      Structure - Impulse Wave 


      Position - Wave (iii) of 5


      Direction - Wave (iii) of 5 still in play


      Details:  Price now in wave iii as it attempts to breach 1.65 wave i low. Wave (iii) is still expected to extend lower in an impulse.


      Natural Gas is currently breaching the previous April low, marking a decisive move as the impulse initiated on 5th March continues its downward trajectory, further extending the overarching impulse wave sequence that commenced back in August 2022. This decline is anticipated to persist as long as the price remains below the critical resistance level of 2.012.


      Zooming in on the daily chart, we observe the medium-term impulse wave originating from August 2022, which is persisting in its downward trend after completing its 4th wave - delineated as primary wave 4 in blue (circled) - at 3.666 in October 2023. Presently, the 5th wave, identified as primary blue wave 5, is underway, manifesting as an impulse at the intermediate degree in red. It is envisaged that the price will breach the February 2024 low of 1.533 as wave 5 of (3) seeks culmination before an anticipated rebound in wave (4). This confluence of price movements underscores the bearish sentiment prevailing over Natural Gas in the medium term.


      Analyzing the H4 chart, we initiated the impulse wave count for wave (3) from the level of 2.012, which marks the termination point of wave 4. Notably, price action formed a 1-2-1-2 structure, with confirmation established at 1.65 and invalidation set at 2.012. The confirmation of our anticipated direction materialized as price breached the 1.65 mark, signifying a resumption of bearish momentum. Presently, there appears to be minimal resistance hindering the bears, thereby reinstating their dominance in the market. It is projected that wave iii of (iii) of 5 will manifest around 1.43, indicative of the potential for the wave 5 low to extend to 1.3 or even lower. This comprehensive analysis underscores the prevailing bearish outlook for Natural Gas in the immediate future.


      Technical Analyst : Sanmi Adeagbo
       
        • Like
    • Meta Platforms’ earnings round-up: Share price plunged despite 1Q beat
      Meta’s share price plunged as much as 16% in post-market trading, following the release of its 1Q 2024 results.
×
×
  • Create New...
us