Jump to content

DAX 30 Looking Weak as General Election Looms


MongiIG

1,012 views

KEY TALKING POINTS:

  • The DAX 30 hits a one-month low as the pullback continues
  • German elections could cause some volatility in the next few weeks

dax.png

The DAX 30, which will become the DAX 40 from the 20th of September, continues to be rejected at the 16,000 mark despite having attempted to consolidate higher momentum around 15,800 for the past few weeks. The index, which is the worst performer so far today, is now resting on its 100-day moving average and is likely to find some support before it reaches the 15,600 mark.

DAX 30 Daily Chart

DAX 30 Looking Weak as General Election Looms

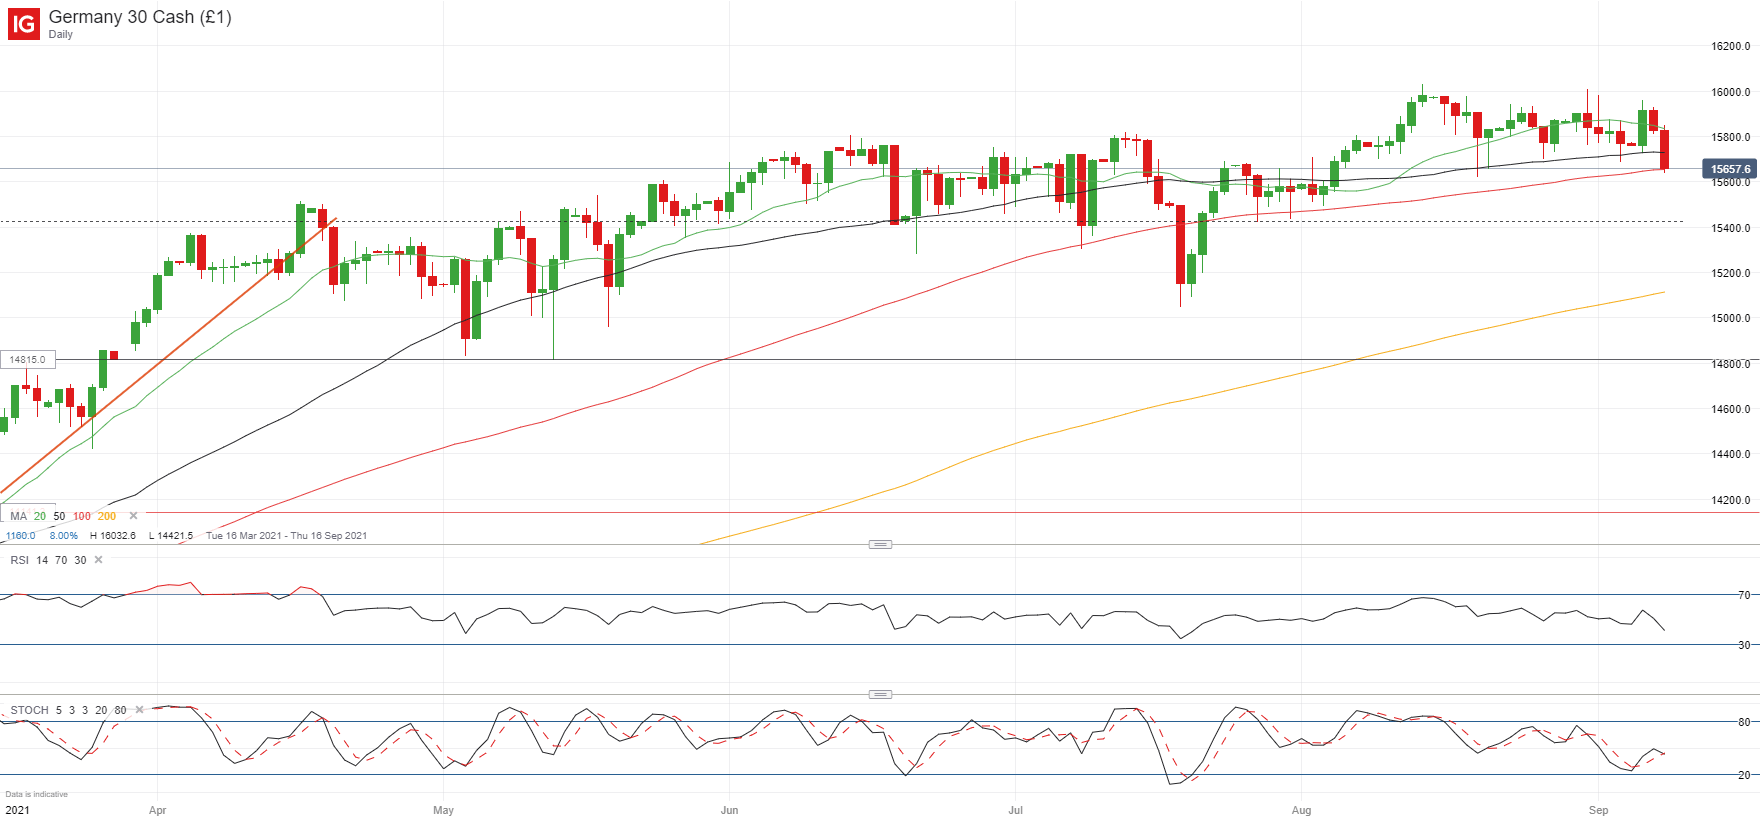
Both the RSI and the Stochastic are showing signs of further weakness ahead so we may see the DAX 30 pullback to its Fibonacci support (15,424) once again before the next decisive move higher. At this point its hard to really change your thoughts on the general trend in equities being higher as the last few months have served to slowly squeeze out the bears but this pullback does seem to have a little more meaning to it, although I wouldn’t say that out too loud as I’d likely catch my fingers with the next upside reversal likely to come over the next few days.

If by any chance it does work out that momentum is able to turn lower, then I would set my eye on the area between 15,000 and 14,815 as a good target, but this may be a trade with a longer time frame. I’d also keep an eye out for the 200-day SMA as if the uptrend continues it will drift higher and that could possibly raise the area of support going forward.

FEDERAL ELECTIONS

Probably an event to look out for when trading the DAX over the next few weeks is the upcoming national election in Germany, as after 16 years of Merkel there seems to be a wider range of possible outcomes, making it a bit more daunting for traders. That said, the likelihood of a long-lasting impact on the stock market is quite small given how it looks likely that there will need to be a three-way coalition government, which will dilute any extreme policies. But we may still see some volatility around the election (26 September) so it is a good idea to keep an eye on the polls, which are now placing the social democrats ahead of Merkel’s conservative CDU party, which will be led by Armin Laschet.

image.png

Written by Daniela Sabin Hathorn, Market Analyst, 8 September 2021. DailyFX

0 Comments


Recommended Comments

There are no comments to display.

Create an account or sign in to comment

You need to be a member in order to leave a comment

Create an account

Sign up for a new account in our community. It's easy!

Register a new account

Sign in

Already have an account? Sign in here.

Sign In Now
  • Blog Statistics

    • Total Blogs
      3
    • Total Entries
      2,821
  • Latest Forum Topics

  • Our picks

    • Are these the best AI stocks to watch in May 2024?
      Microsoft, Apple, Nvidia, Amazon and Meta could be the best AI stocks to watch next month. These stocks are the largest AI stocks in the US based on market capitalisation.
    • Natural Gas Commodity Elliottwave Technical Analysis
      Natural Gas


      Mode - Impulsive 


      Structure - Impulse Wave 


      Position - Wave (iii) of 5


      Direction - Wave (iii) of 5 still in play


      Details:  Price now in wave iii as it attempts to breach 1.65 wave i low. Wave (iii) is still expected to extend lower in an impulse.


      Natural Gas is currently breaching the previous April low, marking a decisive move as the impulse initiated on 5th March continues its downward trajectory, further extending the overarching impulse wave sequence that commenced back in August 2022. This decline is anticipated to persist as long as the price remains below the critical resistance level of 2.012.


      Zooming in on the daily chart, we observe the medium-term impulse wave originating from August 2022, which is persisting in its downward trend after completing its 4th wave - delineated as primary wave 4 in blue (circled) - at 3.666 in October 2023. Presently, the 5th wave, identified as primary blue wave 5, is underway, manifesting as an impulse at the intermediate degree in red. It is envisaged that the price will breach the February 2024 low of 1.533 as wave 5 of (3) seeks culmination before an anticipated rebound in wave (4). This confluence of price movements underscores the bearish sentiment prevailing over Natural Gas in the medium term.


      Analyzing the H4 chart, we initiated the impulse wave count for wave (3) from the level of 2.012, which marks the termination point of wave 4. Notably, price action formed a 1-2-1-2 structure, with confirmation established at 1.65 and invalidation set at 2.012. The confirmation of our anticipated direction materialized as price breached the 1.65 mark, signifying a resumption of bearish momentum. Presently, there appears to be minimal resistance hindering the bears, thereby reinstating their dominance in the market. It is projected that wave iii of (iii) of 5 will manifest around 1.43, indicative of the potential for the wave 5 low to extend to 1.3 or even lower. This comprehensive analysis underscores the prevailing bearish outlook for Natural Gas in the immediate future.


      Technical Analyst : Sanmi Adeagbo
       
        • Like
    • Meta Platforms’ earnings round-up: Share price plunged despite 1Q beat
      Meta’s share price plunged as much as 16% in post-market trading, following the release of its 1Q 2024 results.
×
×
  • Create New...
us