

Rintel
-
Posts
109 -
Joined
-
Last visited
-
Days Won
7
Content Type
Profiles
Forums
Blogs
Events
Community Tutorials
Store
Posts posted by Rintel
-
-
On 19/04/2021 at 08:10, Rintel said:
Ripple....... Talk about a gap....
 7 hours ago, Rintel said:
Error the date on the post should read 20-04-21
FYSE 100 update.... 22-04-2021... Still marching ( Volatility model nailed this one) 🙂

-
Error the date on the post should read 20-04-21
-
Quick Model Update On BTC-USD Still bullish
BTC-USD ( 54K) Top of the range ( 62K) Bottom ( 54K)
8%- 15% upside from these levels.
I just measured the returns from the peak we had on the 13th of April 2021
In terms of the dispersion, that entire move is >1 standard deviation from the average return. Extreme moves like this often get corrected


The Risk reward is alot better from these levels .
Becareful out there
CA
-
18 hours ago, Rintel said:
Good evening ; FTSE 100 still bullish 686.
( 700.1 ---- 677)
Model Output for volatility
Looking at the spread between the latest volatility data from the FTSE differentiated with respect to previous volatility data, it looks like this is a minor correction. Statistically speaking, looking for entries around here or at lower price levels should offers a very good risk reward. Hopefully we get to the low-end of the range at higher vol. What you want to be doing is making purchases as that spread ( red line) edges closer to the bottom of the volatility adjusted range ( purple) .


See you all tmrw
CA

Update
Who would have thought eh ? -
Better a picture than a 10page waffle

Gold is now higher than it was a year ago.
Interesting analysis from the price model. What could this mean ? Correction ? Or a new trend ? Will need more data. Gold bulls have been getting involved since the big dip in March. Deflation as interest rates rollover by end of year ? Need more data.

-
Good evening ; FTSE 100 still bullish 686.
( 700.1 ---- 677)
Model Output for volatility
Looking at the spread between the latest volatility data from the FTSE differentiated with respect to previous volatility data, it looks like this is a minor correction. Statistically speaking, looking for entries around here or at lower price levels should offers a very good risk reward. Hopefully we get to the low-end of the range at higher vol. What you want to be doing is making purchases as that spread ( red line) edges closer to the bottom of the volatility adjusted range ( purple) .
See you all tmrw
CA
-
According to the math , we are nearing the top end of the returns range. Fade consensus stick with the math.

-

mom analysis on the returns of XRP. Is the juice worth the squeeze at this moment ? I think it’s better to sit this one out -
6 hours ago, Rintel said:
Refreshed the Model at 4:30 am this morning. Plus it has now reached the low end of its trading range. Statistically, you actually now want to be buying the dip.

There you go..... listen to the math people...... no need to guess.
-
12 minutes ago, Rintel said:
Ripple....... Talk about a gap.... You are probably better off setting your sights on this....
-
12 minutes ago, Rintel said:
Refreshed the Model at 4:30 am this morning. Plus it has now reached the low end of its trading range. Statistically, you actually now want to be buying the dip. Don't know where the bottom is will need more incoming data in the days ahead.


Top is its volatility spread bottom is its price.
Interesting observation from the volatility spread, Notice how the peaks keep decreasing in amplitude but the troughs remain roughly in the same place ? I think Bitcoin is getting tired. Combine that with the current economic outlook which is potentially a slow down in the economy in the second half of the year, economic slowdows= not good for speculative assets. I don't participate in the coins-space, good for trading tho.
-
11 hours ago, HMB said:
Call this is a biased post - but I hated Bitcoin before I went short - so with this disclosure, let me just repeat some "fundamentals" to add to above math...: imagine you missed the opportunity to take part in the unwinding of the greatest spoof in history... how would you explain that to your grand kids..?
In times of drastically increasing climate change concerns, out of lack of trust in their democratic institutions, people of the developed world put their money voluntarily into an unregulated pseudo asset, administered by "miners" who no one knows, which reside mostly in a country run by a totalitarian regime, which already started to shut them down for excessive energy consumption, and with a legal system which is at best obscure to the average Bitcoin "investor", who most likely doesn't even know a single symbol of their language?
You couldn't make that up.
Masses fooled once again by a conflicted interest bunch who (for more than a decade) have been drawing on the US inflation narrative - while 30 year USD real yields stand at a grotesque seven basis points. Fiat currency debasement - my ****!
Congrats to the Coinbase insiders who sold shortly after the IPO.
Refreshed the Model at 4:30 am this morning. Plus it has now reached the low end of its trading range. Statistically you actually now want to be buying the dip.
Top is its volatility spread bottom is its price.
-
1 minute ago, Rintel said:
Masses fooled once again by a conflicted interest bunch who (for more than a decade) have been drawing on the US inflation narrative - while 30 year USD real yields stand at a grotesque seven basis points. Fiat currency debasement - my ****!
The never ending hyper inflation story. I remember Juliet Declerque writing a report about how the US will become a vassal state to China, because treasury yields blahblah blah inflation blah blah.
-
 1
1
-
-
45 minutes ago, HMB said:
Call this is a biased post - but I hated Bitcoin before I went short - so with this disclosure, let me just repeat some "fundamentals" to add to above math...: imagine you missed the opportunity to take part in the unwinding of the greatest spoof in history... how would you explain that to your grand kids..?
In times of drastically increasing climate change concerns, out of lack of trust in their democratic institutions, people of the developed world put their money voluntarily into an unregulated pseudo asset, administered by "miners" who no one knows, which reside mostly in a country run by a totalitarian regime, which already started to shut them down for excessive energy consumption, and with a legal system which is at best obscure to the average Bitcoin "investor", who most likely doesn't even know a single symbol of their language?
You couldn't make that up.
Masses fooled once again by a conflicted interest bunch who (for more than a decade) have been drawing on the US inflation narrative - while 30 year USD real yields stand at a grotesque seven basis points. Fiat currency debasement - my ****!
Congrats to the Coinbase insiders who sold shortly after the IPO.
"Bitcon" maximalists don't realise that bitcon's greatest achievement is giving governments the tools to be able to track their citizens, with the same tech they think guarantees their freedom...
-
1
-
-
8 hours ago, HMB said:
50K might be a too conservative target... any thoughts? 43? 25...?

Math says there is still a lot of downside risk

-
18 hours ago, Courage said:
Current Economic Leading Indicator Outlook: Always Look At The Big Picture
The last 9 months have been nothing but epic in terms of the performance of risk asset if you have made some money great! If you have lost some, don't worry there is always a bull market somewhere.
Given the current confidence and state of affairs, I think it's time we begin to begin to reassess our current economic situation. Bonds have been getting destroyed since the relation story started to take a hold late last year, commodities have been spectacular as inflation has risen due to base effects. The YoY growth in rates ? PHOAR! talk about a rally eh? Now, however, we are reaching important levels (IMHO). When I look at the economic fallout post covid, there is still a lot of scaring left over as a result of the lockdowns. Many people are unemployed and under employed and a lot of support is still needed. Yes, prices are rising and businesses are opening up again but there is still ALOT of work to be done. Inequality still needs to be addressed, countries are still battling the pandemic and the stop start nature of re-openings and closures, all pose a significant hurdle to growth.
Also, before the lockdown, there were a lot of structural issues in the economy that needed to be addressed. These issues ( demographics, high government debt to GDP encouraged by record low interest rates) are still with US and over the coming months, my guess is that once the inflationary impulse is done with, we will see these issues come back to surface as they have not yet been dealt with.
I use the ism as a cyclical indicator. It is a survey I use as a means to gauge the speed of the economy , the current reading for the US sits at > 64. Highest level since 1988. Normally around these levels , the ism tends to begin to decelerate. See below. ( source trading economics)

Also, the employment situation needs to be addressed , > 13 million people require support from the US government. (Source macrotechnicals).

Inflation is here yes, however, we should now start thinking about the consequences of higher prices; If companies have higher input prices, there is a ceiling to how much of those prices can be passed on to consumers. If the consumers are unemployed , there is potentially a demand issue which will result in companies having no choice but to take those prices down this has a knock on effect on the supply chain resulting in lower input prices. Currently, the euro area is in the midst of a 5 year high in prices.

At some point, this will start to matter.
Lastly and most importantly, the rise in interest rates on a year over year basis is reaching a point where historically, there has always been a slow down in the rise of rates. Cyclical pattern has been in place since 1994. This was a tool I used to prepare for the reflation theme we experienced over the last 9 months.

I am not calling for imminent deflationary collapse. I am simply saying statistically, we could be heading for bumpy roads as global governments attempt to heal the scaring caused by the mandated lockdowns.
So What Is The Play?
The play is simple; Should lower inflation becomes a reality I would want to own Bonds, the Dollar, Gold, Gold miners Tech, High quality and low beta stocks. Not right here right now of course as I still think there is a little more room left in the tank for inflation. But I would start adding these securities to a watchlist for observational purposes . Watch their performance on a regular basis to see for periods when the market potentially starts to sniff these economic conditions out.
Risks To MY View ?
If we get an infrastructure bill for the US then inflation is going a lot higher and bonds will continue to languish . And it will mean my view is wrong. At that point I will stay with the reflation and growth story buying more commodities, value and growth companies until the cows some home.
Good luck out there.
CA
Lastly, its been a little slow with ranges this week. Mad week at the offie. Will hopefully be able to get back on top of things next week. I wrote this in one take. You will probably find gramatical errors. Try to ignore them and focus on the key ideas. ☺️
charts are all courtesy of macro-technicals.
-
Current Economic Leading Indicator Outlook: Always Look At The Big Picture
The last 9 months have been nothing but epic in terms of the performance of risk asset if you have made some money great! If you have lost some, don't worry there is always a bull market somewhere.
Given the current confidence and state of affairs, I think it's time we begin to begin to reassess our current economic situation. Bonds have been getting destroyed since the relation story started to take a hold late last year, commodities have been spectacular as inflation has risen due to base effects. The YoY growth in rates ? PHOAR! talk about a rally eh? Now, however, we are reaching important levels (IMHO). When I look at the economic fallout post covid, there is still a lot of scaring left over as a result of the lockdowns. Many people are unemployed and under employed and a lot of support is still needed. Yes, prices are rising and businesses are opening up again but there is still ALOT of work to be done. Inequality still needs to be addressed, countries are still battling the pandemic and the stop start nature of re-openings and closures, all pose a significant hurdle to growth.
Also, before the lockdown, there were a lot of structural issues in the economy that needed to be addressed. These issues ( demographics, high government debt to GDP encouraged by record low interest rates) are still with US and over the coming months, my guess is that once the inflationary impulse is done with, we will see these issues come back to surface as they have not yet been dealt with.
I use the ism as a cyclical indicator. It is a survey I use as a means to gauge the speed of the economy , the current reading for the US sits at > 64. Highest level since 1988. Normally around these levels , the ism tends to begin to decelerate. See below. ( source trading economics)
Also, the employment situation needs to be addressed , > 13 million people require support from the US government. (Source macrotechnicals).
Inflation is here yes, however, we should now start thinking about the consequences of higher prices; If companies have higher input prices, there is a ceiling to how much of those prices can be passed on to consumers. If the consumers are unemployed , there is potentially a demand issue which will result in companies having no choice but to take those prices down this has a knock on effect on the supply chain resulting in lower input prices. Currently, the euro area is in the midst of a 5 year high in prices.
At some point, this will start to matter.
Lastly and most importantly, the rise in interest rates on a year over year basis is reaching a point where historically, there has always been a slow down in the rise of rates. Cyclical pattern has been in place since 1994. This was a tool I used to prepare for the reflation theme we experienced over the last 9 months.
I am not calling for imminent deflationary collapse. I am simply saying statistically, we could be heading for bumpy roads as global governments attempt to heal the scaring caused by the mandated lockdowns.
So What Is The Play?
The play is simple; Should lower inflation becomes a reality I would want to own Bonds, the Dollar, Gold, Gold miners Tech, High quality and low beta stocks. Not right here right now of course as I still think there is a little more room left in the tank for inflation. But I would start adding these securities to a watchlist for observational purposes . Watch their performance on a regular basis to see for periods when the market potentially starts to sniff these economic conditions out.
Risks To MY View ?
If we get an infrastructure bill for the US then inflation is going a lot higher and bonds will continue to languish . And it will mean my view is wrong. At that point I will stay with the reflation and growth story buying more commodities, value and growth companies until the cows some home.
Good luck out there.
CA
Lastly, its been a little slow with ranges this week. Mad week at the offie. Will hopefully be able to get back on top of things next week. I wrote this in one take. You will probably find gramatical errors. Try to ignore them and focus on the key ideas. ☺️
-
2 hours ago, HMB said:
thanks. the ranges you provide are not symmetric around the previous close - so there is a mean return assumption?
(interesting paper - providing some evidence for vol of vol being a return driver - can't see the connection to the risk ranges immediately - except maybe the general insight that the width of the ranges needs to be updated frequently - you "wrote paper I derived this calculation for" - you're one of the authors?
Nah I didn't write the paper, took multiple reads to understand the concept and I'm sure someone is going to one day tell me I'm wrong haha. Got a monkey brain my friend 😆. What I meant to say was I derived the formula as in I "borrowed" it . And yes there are assumptions impeded in the math also, Its not perfect because it doesn't seem to work on securities that don't have options data. Which is a huge limitation. I am currently working on with someone with bigger brains than I have to come up with a solution to fix that.
Think of the ranges as moving targets , the calculation takes vol and price into consideration. The most important thing to watch is the the change of the width. Not necessarily the width itself. If the range is stable and a security is making higher highs and higher lows , with volatility slipping = super bullish, opposite = bearish.
-
This Is Why You NEVER EVER Buy Anything At The Top Of The Range


-
-
Oil Risk Range 14/04/2021
Risk range for Crude Bullish
Last Price (60.96)
Top Range 65.96 Low Range 58.50
Oil Volatility (OVX) last 35.26 Bearish Top Range 42.72 Low range 35.51.
This is an interesting one because the oil price is near the low end of the range and it's volatility is at the low end of the range.
One of two possible scenarios ;
A) Oil vol keeps getting compressed and it blows past the low end of the range and oil goes a lot higher. Or
B) Oil vol bounces off the low end and oil corrects a little more. I am not sure .
Still have a positive bias on the inflation story but net volume in percentage also looks like it is dropping a little bit . I have no positions in Oil FYI. My take on it ; air on the side of caution. Maybe a small starter position ( 0.12-0.25%) is appropriate as a starter position
For me to be a ragging bull, I need Oil Vol to be at the top end of the trading range.
-
12 hours ago, HMB said:
how do you calculate these - if you don't mind..?
That would be giving away the secret sauce😂. Jking. I can't give you my math because it's customised to my taste in terms of duration of investments, ( I can however tell you the principles and ideas behind the math. If you put it together you can build your own personalised one ( a major component of my model is actually on my profile page 😁)
Price Observations ;
Price moves in a horizontal range in smaller or larger time frames before moving higher or lower.
The objective is to capture the statistical “best price” of a security by purchasing it at or near the bottom end of the volatility adjusted price range if bullish, and sell at or near the top if bearish. ( time frame is user dependent )
Volatility Observations;
Volatility is an important input because it's the measure of dispersion in returns and is always mean reverting.
Implied volatility is also an important component because it is what the market expects volatility in the future to look like. (Time frame of forward outlook is user dependent ).
Calculating this for the VIX AND THE VXN AND BOND MARKET AND OIL SUPER IMPORTANT.
Liner Interpolation ;
Volatility and price generally have an inverse correlation and the ranges are constantly changing, so I use liner interpolation to give me a rough estimate of what range the price could be statistically.
This is one component of my customised risk management approach. Then there is the macroeconomic conditions to consider as well.
Then comes the rest; execution AND PAITIENCE. ie. Having the confidence in the math to buy when people are afraid and sell/reduce exposure when people are euphoric.
I can't attached the paper I derived this calculation for on the platform. But you can find the paper here
-
Morning, here are volatility adjusted trading ranges for today
ISF Last $678.3. ( 690.2-------661.3)
MIDD Last. 2103. ( 2127-------2028)
Vixx last 16.9 ( 18.1-----16.8)
God Bless
CA
-
- Popular Post
- Popular Post
Doing The Least Amount Of Work For The Biggest Possible Return ; There Are No Original Ideas. History Always Repeats Itself.
Part of the investing, is the grindy process of trying to generate new ideas. A lot of people think Hedgefund managers and money managers are more intelligent than the average person. I don't think so. Otherwise they would have figured out that rising rates as the economy opens back up is BULLISH for the economy. Rates rise as the economy improves so do commodities and corporate profits. Yes there is a point at which rates become too high and at which rising rates hinder economic growth due to increased interest payments on private and public sector debt. But the recent rise in the US10yr was absolutely bullish for the economy.
It took me three years to complete a two year A-level so I am not the sharpest guy in the room most times, however, I have noticed since I started doing this that the same stories repeat themselves over and over again. One week it's the Dollar collapse, another week it's the inflation story. There is always one headline or another. Amidst all this it is very easy to get side tracked whilst generating ideas.
I think best ways to generate ideas is to look look at the economic cycle. What part of the cycle are we in ? Are we early ? middle ? or late ?. ( I think we are near the peak give or take a few months. Don't hold me to it I could be spectacular wrong) . Once you make that assessment, you now need to find companies that do well given that part of the economic cycle. Then do your fundamental analysis of balance sheets etc. And then look for a good entry price. Rinse and repeat . Do this and you will notice the same things happen over and over again. This is my second business cycle ( first was 2015-2020) and now, I notice the same things happening again. So yeah these so called " professionals" are not that smart. I would wager they are of average intelligence like the rest of us. Only difference is they just have more money.
Below is a template of investing ideas. I borrowed it from a friend who was kind enough to let me have his ideas spreadsheet. It contains simple ideas that can result in a lot of profits if you get your timing right. Have a read and find ways to implement these strategies at the right time. You do not need to work too hard.
Until next time God Bless.
CA

-
5


FOR NEWCOMERS ONLY ! + ANYONE WHO IS LOOKING FOR A BETTER WAY
in General Trading Strategy Discussion
Posted
Dashboard Review
Last week we heard headlines about taxes, crypto's blah blah blah, in summary, people were spooked. Let's just take breather and actually look at performance shall we ?
Volatility crushed but up in the last two weeks ( might be due to the crypto carnage) interesting that oil volatility is up on the week and also up in the last three months and up in the last 6 weeks. This may start to matter in the coming weeks perhaps the market is starting to sniff out slower growth ? Airlines benefit from lower oil costs.
US equity style factors look good down on the week but over all green both in the short and long time frames. Situations like these = people buying the dip. Small caps leading the way into the close.
In the last week most sectors were down aside from Real Estate, Materials , Industrials and Healthcare. With Real Estate and Healthcare leading the way. Perhaps, all the news about covid resurgence spooked investors into the familiar covid plays.
Rates were down on the week. But looks like a blip when compared to the MONSTROUS rally they have had vs a year ago.
G20 ETFs ....... notable performance here, from France, Mexico, Brazil,Saudi Arabia and Russia. All up on the week and month.
India, as of close on Friday is now in 3 month trend decline. Note it was one of the darlings of the reflation trade play in emerging market space.
In the FX markets the dollar down momentum continues with the dollar back down on a trending basis. If we are to see a slowdown in the global economy towards the back end of the year look this to start reversing slowly... then all at once. Top three performance in the last month are the Swiss, Euro and Australia.
In the energy space Biofuel can't be touched. Had the best performance this week. Natural gas continues to languish .
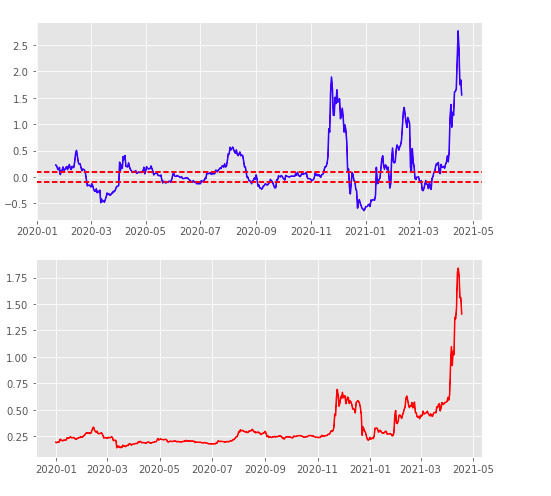
And finally ...........The moment you have all be waiting for...........
What is there to say?? taken out to the back of the barn and shot.... However........ on a yearly basis .......this is JUST A SCRATCH..... could it turn into a puss leaking fatal wound ? See below for the stationary returns of XRP
posted on the 18th of April 2021.....I recall telling a friend not to get sucked in because that was the risk he was actually taking when buying XRP on the 19th of April 2021.
Here is the updated model output
This is now the worst decline in returns since March(ish) can't see the precise date on the charts will need to expand the charts at some-point.
Lets look at Bitcoin
Decline now approaching 2stdev .Freefall ? Buying Opportunity or the beginning of the end ? I dunno. What I do know is an awfullot of people are getting washed out. Long term bulls have been waiting for this to add to positions. I am sure they are getting excited. Im looking at you Raoul GMI.
Anyway that's it for my guys . Until next time
CA