British Pound Technical Analysis – Trends and Reversals: GBP/AUD, GBP/NZD, GBP/CAD

Entry posted by MongiIG in Market News
1,365 views
GBP/AUD, GBP/NZD, GBP/CAD - TALKING POINTS
- Since making a new high, GBP/AUD has been struggling to hold ground of late
- GBP/NZD consolidates after a volatility spike on the move down in late August
- Positive sloping trend lines are still in place for GBP/CAD. Will that continue?

GBP/AUD TECHNICAL ANALYSIS
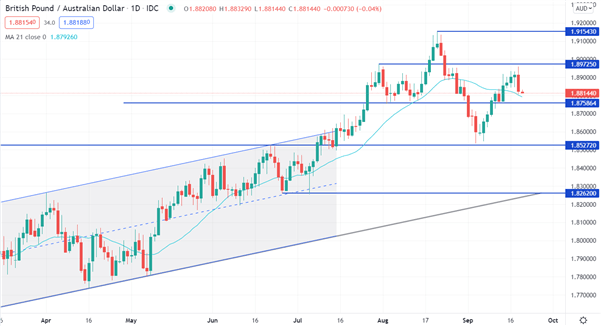
Since making a 15-month high at 1.9154, GBP/AUD has bounced off a support level at 1.8527 and consolidated within a range. Since rallying from that low, we have seen an ascending trend evolve. However, yesterday we saw a bearish Engulfing pattern, which might suggest a reversal and a possible test lower.
The 21-day simple moving average (SMA) has been pivotal in this sideways environment and the cross is again approaching this threshold, currently at 1.8793. Just below the 21-day SMA is a pivot point at 1.8759.
Potential support for GBP/AUD may lie at the pivot point level of 1.8527, which was established from the high of October last year. Additional support could be at a previous low of 1.8262, which also closely coincides with a bigger picture trend line support.
On the topside, potential resistance levels could be at the reverse pivot point of 1.8972, which is just above yesterdays high of 1.8961, and the high seen last month of 1.9154.
GBP/NZD TECHNICAL ANALYSIS
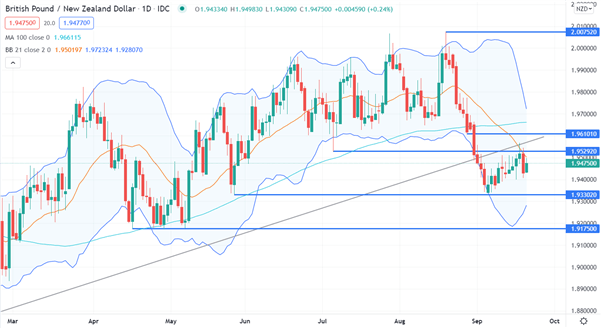
Going into the end of August, the GBP/NZD snapped below the 100-day SMA and created a pivot point at 1.9637 that could now provide resistance. On the run down, the cross continually nudged against the lower bound of the 21-day SMA based Bollinger Band, speaking to increasing volatility. It has since retreated inside the bands.
The recent price action has seen GBP/NZD struggle to hold ground above the 21-day SMA, currently 1.9502, and the previous pivot point at 1.9529. These two levels might provide resistance if tested.
If downward momentum resumes, the previous lows of 1.9330 and 1.9175 may provide some support. Additionally, a short-term trend line at 1.9420 could provide some additional underpinning.
GBP/CAD TECHNICAL ANALYSIS
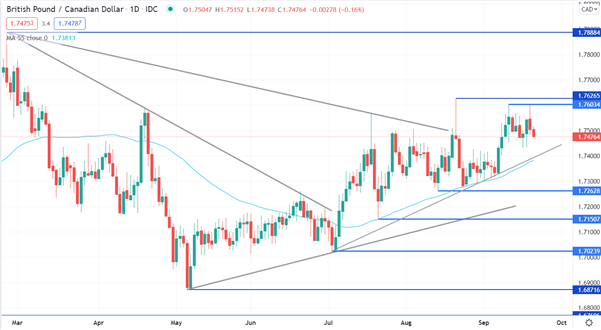
The GBP/CAD cross has been trending higher since making a low at 1.6872 in May. Since moving above the 21-day SMA in July, the cross has not been back below it and the gradient of the moving average line remains positive.
Above the market, the previous highs of 1.7603 and 1.7626 might offer some resistance. Below the market, support may be provided at the current 21-day SMA level of 1.7381 and at the previous lows of 1.7263, 1.7151, 1.7024 and 1.6872.
Written by Daniel McCarthy, Strategist for DailyFX.com. 21 September 2021.


0 Comments
Recommended Comments
There are no comments to display.
Create an account or sign in to comment
You need to be a member in order to leave a comment
Create an account
Sign up for a new account in our community. It's easy!
Register a new accountSign in
Already have an account? Sign in here.
Sign In Now