Canadian Dollar Caged in by Inflation Favouring USD on Energy. Where to for USD/CAD?

Entry posted by MongiIG in Market News
580 views
CANADIAN DOLLAR, USD/CAD, US DOLLAR, INFLATION, US YIELDS - TALKING POINTS:
- The Canadian Dollar was overwhelmed by US yields despite sky-high crude oil.
- APAC equities lost ground as inflationary fears from energy markets grow.
- USD stronger, including against commodity currencies. Where to for USD/CAD?

The Canadian Dollar retreated today as the US Dollar found support, with yields moving aggressively higher on inflationary fears. The energy surge continues, with Brent crude oil approaching US$ 80 a barrel and US natural gas at levels last seen in 2008. The main APAC equity bourses went lower despite a positive lead from Wall Street.
The spike in inflation earlier in the year was dismissed as a ‘base effect’. As the low numbers of 2020 rolled out of the annual number. The high inflation then became a ‘transitory’ phenomenon.
Energy prices are a significant component of inflation indicators the world over. Some inflation indicators exclude volatile items, such as oil and gas. However, the energy market surge may have flow-on effects for other components in the inflation basket.
As oil, coal and liquefied natural gas continue to rocket higher, markets are asking “how long does ‘transitory’ last?” This question drove long end yields higher today. The US 30-year is at 2.14% (+0.045%) and 10-year is at 1.566% (+0.04%). This supported the US Dollar and drove USD/CAD higher.
If inflation remains higher for longer, long duration bets deteriorate from a risk-return perspective. In this environment, investors prefer to sell long bonds and move further down the yield curve toward cash.
US Democratic Senator Elizabeth Warren continued to express dismay about the performance of Federal Reserve Chairman Jerome Powell. His current term is due to expire in February and up until now it had been widely expected that he would be stamped with another one.
While Ms Warren’s focus was on the integrity of fellow Fed members, market participants might start to ask questions around what prolonged transitory inflation means for US economic prosperity.
The RBNZ raised the official cash rate (OCR) rates by 25 basis points to 0.50% today as domestic pressures forced their hand despite an uptick in Covid-19 cases. As USD moved higher on safe-haven buying, NZD went lower with AUD and to a lesser extent CAD and NOK, as the latter have significant oil exports.
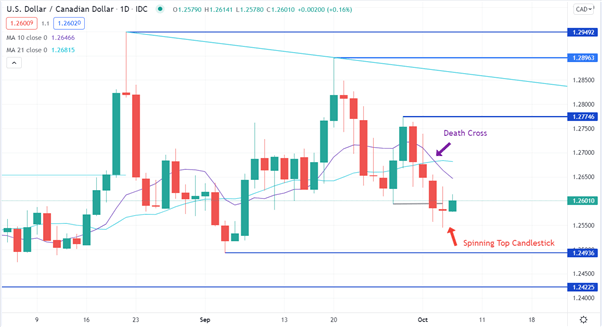
USD/CAD TECHNICAL ANALYSIS
USD/CAD has consolidated today after several session of making lower lows. A short-term Death Cross was made on the move lower when the 10-day simple moving average (SMA) crossed below the 21-day SMA.
Yesterday’s price action created a bullish Spinning Top. Resistance might be found at the previous highs of 1.27746, 1.28963 and 1.29492. On the downside, support could be provided at the previous lows of 1.24936 and 1.24225.
Written by Daniel McCarthy, Strategist for DailyFX.com. 6th October 2021


.jpeg.98f0cfe51803b4af23bc6b06b29ba6ff.jpeg)


0 Comments
Recommended Comments
There are no comments to display.
Create an account or sign in to comment
You need to be a member in order to leave a comment
Create an account
Sign up for a new account in our community. It's easy!
Register a new accountSign in
Already have an account? Sign in here.
Sign In Now