Jump to content

GBP/AUD Price Outlook: Nearing Support After Sharp Falls, Inflation Jitters in Focus


MongiIG

809 views

GBP/AUD PRICE, NEWS AND ANALYSIS:

  • Rising inflation has become an important driverof foreign exchange rates recently but data from Australia Wednesday showed a surprisingly large fall year/year.
  • By contrast, the scope for UK Chancellor of the Exchequer Rishi Sunak to boost the economy in today’s UK Budget will likely be held back by increases in inflation that have raised the cost of servicing the national debt.
  • That’s broadly positive for GBP/AUD as it approaches an important band of support after weeks of losses.

forex daily analysis GBPAUD multi-timeframe analysis - YouTube


GBP/AUD NEARS SUPPORT

GBP/AUD has been falling steadily since reaching a recent high at 1.9155 on August 20, dropping to around 1.8296 at the time of writing. Those losses were extended Wednesday even though Australia reported that its inflation rate fell to 3.0% year/year in the third quarter – below both the forecast 3.1% and the previous 3.8%. However, GBP/AUD is now approaching an important band of support that should at least stem the losses for a while.

As the chart below shows, GBP/AUD traded just above the 1.82 level throughout June and that level will need to be broken convincingly if the downturn is to extend. More likely it will steady there, with a minor rally following.

GBP/AUD PRICE CHART, DAILY TIMEFRAME (APRIL 12 – OCTOBER 27, 2021)

Latest GBP/AUD price chart.

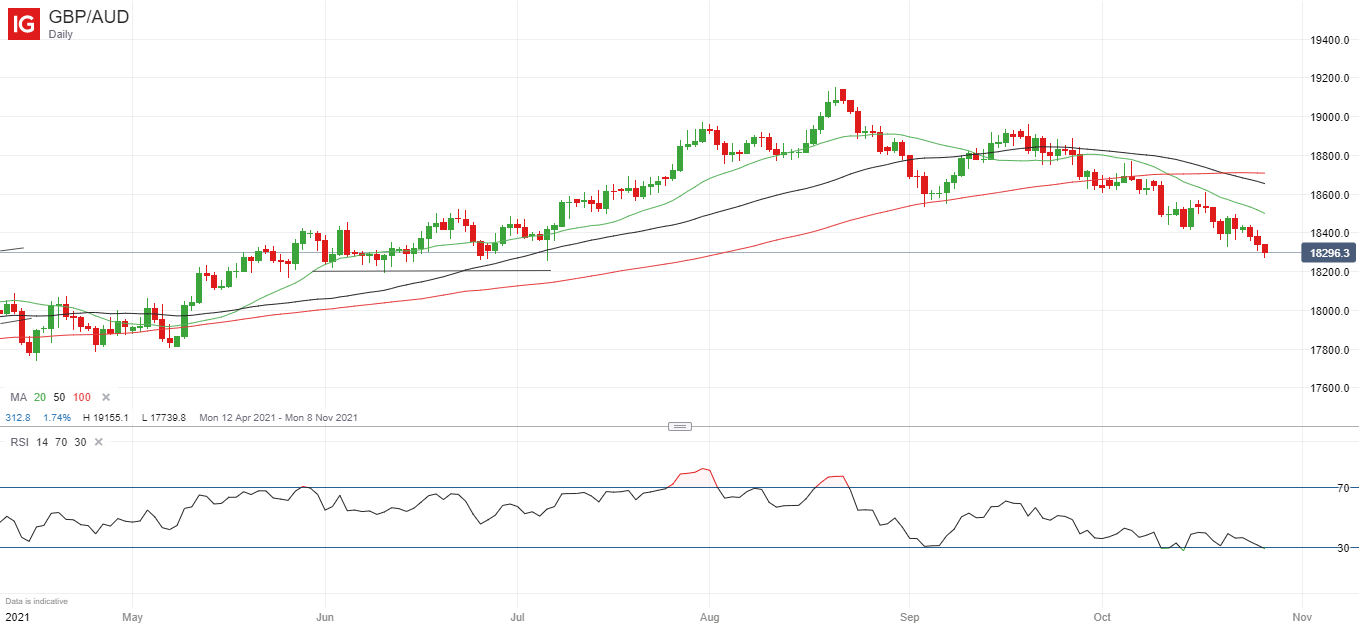
Source: IG (You can click on it for a larger image)


INFLATION KEY TO UK BUDGET

While the headline Australian inflation rate fell in Q3, inflation in the UK is a problem for UK Chancellor of the Exchequer Rishi Sunak as he prepares for his set-piece Budget Wednesday. Inflation expectations in the UK are currently at their highest since 2008, and the rate could top 5% by early next year, the Bank of England’s new Chief Economist Huw Pill warned a few days ago.

The Budget itself rarely moves GBP but rising inflation will nonetheless hamper Sunak’s spending plans and is broadly positive for the currency.

Note, though, that core inflation in Australia has hit its highest for six years and that could prompt the Reserve Bank of Australia to tighten monetary policy earlier than previously expected, perhaps by July next year. If that narrative begins to dominate sentiment, GBP/AUD would likely resume its decline once it has consolidated around current levels.


Written by Martin Essex, Analyst, 27th October 2021. DailyFX

0 Comments


Recommended Comments

There are no comments to display.

Create an account or sign in to comment

You need to be a member in order to leave a comment

Create an account

Sign up for a new account in our community. It's easy!

Register a new account

Sign in

Already have an account? Sign in here.

Sign In Now
  • Blog Statistics

    • Total Blogs
      3
    • Total Entries
      2,821
  • Latest Forum Topics

  • Our picks

    • Are these the best AI stocks to watch in May 2024?
      Microsoft, Apple, Nvidia, Amazon and Meta could be the best AI stocks to watch next month. These stocks are the largest AI stocks in the US based on market capitalisation.
    • Natural Gas Commodity Elliottwave Technical Analysis
      Natural Gas


      Mode - Impulsive 


      Structure - Impulse Wave 


      Position - Wave (iii) of 5


      Direction - Wave (iii) of 5 still in play


      Details:  Price now in wave iii as it attempts to breach 1.65 wave i low. Wave (iii) is still expected to extend lower in an impulse.


      Natural Gas is currently breaching the previous April low, marking a decisive move as the impulse initiated on 5th March continues its downward trajectory, further extending the overarching impulse wave sequence that commenced back in August 2022. This decline is anticipated to persist as long as the price remains below the critical resistance level of 2.012.


      Zooming in on the daily chart, we observe the medium-term impulse wave originating from August 2022, which is persisting in its downward trend after completing its 4th wave - delineated as primary wave 4 in blue (circled) - at 3.666 in October 2023. Presently, the 5th wave, identified as primary blue wave 5, is underway, manifesting as an impulse at the intermediate degree in red. It is envisaged that the price will breach the February 2024 low of 1.533 as wave 5 of (3) seeks culmination before an anticipated rebound in wave (4). This confluence of price movements underscores the bearish sentiment prevailing over Natural Gas in the medium term.


      Analyzing the H4 chart, we initiated the impulse wave count for wave (3) from the level of 2.012, which marks the termination point of wave 4. Notably, price action formed a 1-2-1-2 structure, with confirmation established at 1.65 and invalidation set at 2.012. The confirmation of our anticipated direction materialized as price breached the 1.65 mark, signifying a resumption of bearish momentum. Presently, there appears to be minimal resistance hindering the bears, thereby reinstating their dominance in the market. It is projected that wave iii of (iii) of 5 will manifest around 1.43, indicative of the potential for the wave 5 low to extend to 1.3 or even lower. This comprehensive analysis underscores the prevailing bearish outlook for Natural Gas in the immediate future.


      Technical Analyst : Sanmi Adeagbo
       
        • Like
    • Meta Platforms’ earnings round-up: Share price plunged despite 1Q beat
      Meta’s share price plunged as much as 16% in post-market trading, following the release of its 1Q 2024 results.
×
×
  • Create New...
us