Jump to content

Dollar index pauses at 16-month high, with uptrend expected to dominate going forward


MongiIG

1,027 views

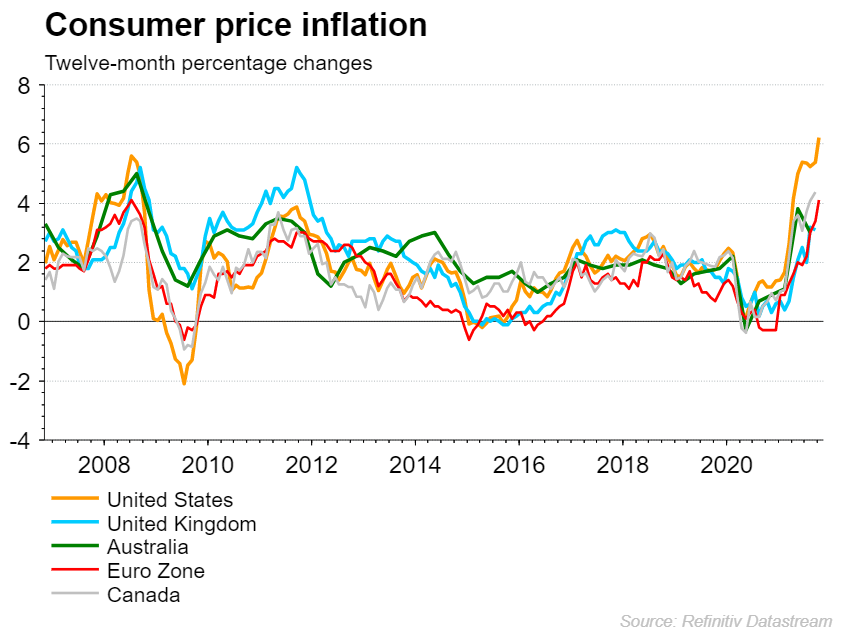
US inflation pressure looks likely to maintain the push on the Fed to tighten, with the dollar index reaching a 16-month high.

bg_usd_us_dollar_361541599.jpgSource: Bloomberg
 Joshua Mahony | Senior Market Analyst, London | Publication date: Monday 15 November 2021

The Federal Open Market Committee (FOMC) decision to kick off its tapering phase this month brings a focus on US monetary policy that could help drive the dollar higher.

While the likes of the UK (3.1%), Australia (3%), eurozone (4.1%), and Canada (4.4%) undoubtedly have elevated inflation figures, it is the US that continues to lead the way on that front (6.2%).

While markets are widely expecting to see tapering complete in June 2022 and a rate rise in that same month, continued inflation pressures could bring a ramp up in that process.

With that in mind, traders will be keeping a close eye out for pricing pressures over the coming months. Meanwhile, this week sees the latest consumer price index (CPI) figures from the UK and Canada.

CPI_compared_151121.png


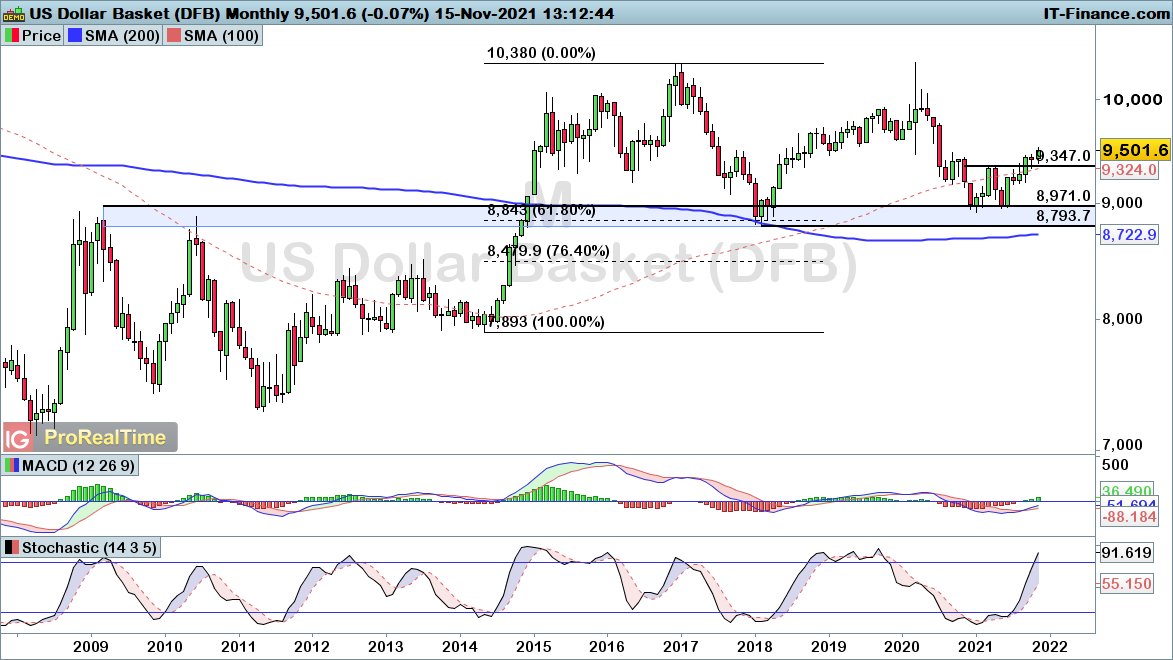
The dollar index hit a 16-month high last week, with the greenback building off the back of a double bottom formation completed in September. That double bottom came off the back of a decline into the key 87.93-89.71 support zone.

While we are now well into overbought territory, the stochastic continues to push higher with little sign of tightening between the stochastic and signal lines.

DX-Monthly151121.pngSource: ProRealTime


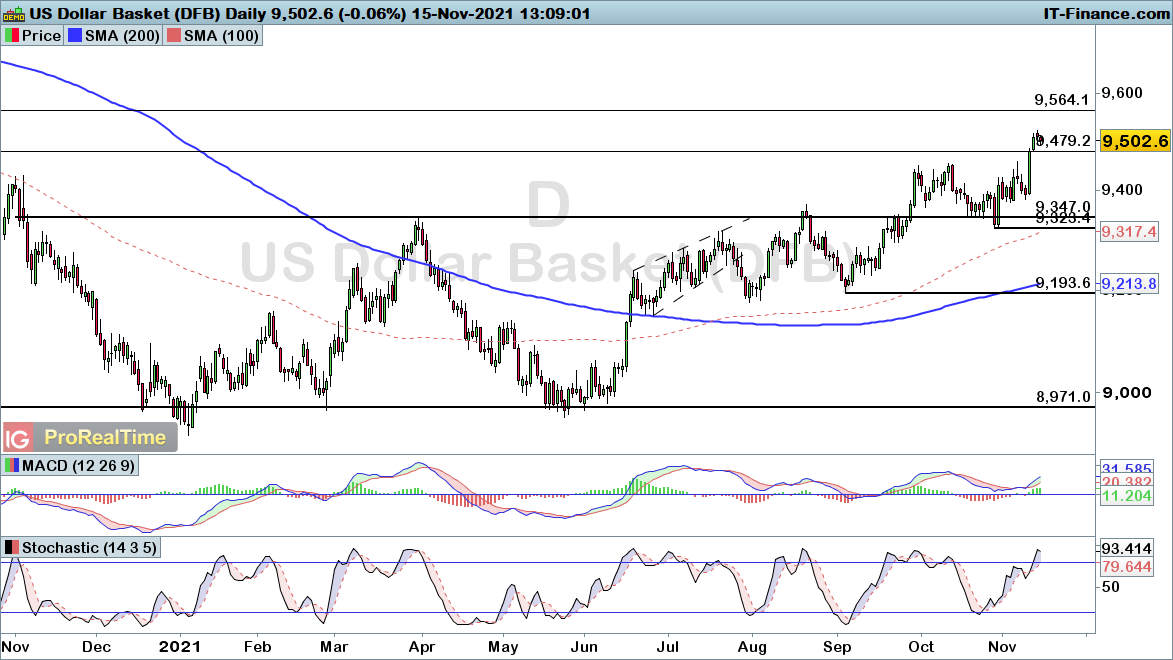
The daily chart highlights how price has started to fade somewhat after this latest surge, with the stochastic well into overbought territory.

This could bring a bearish phase if we see the stochastic break back below the 80 threshold. Whether we see that pullback remains to be seen.

Ultimately we do have a clear preference for further upside before long given the uptrend in place throughout the second half of 2021. As such, any near-term downside would be deemed as a precursor to another leg higher unless we break back below the October low of 93.23.

DX-Daily151121.pngSource: ProRealTime

0 Comments


Recommended Comments

There are no comments to display.

Create an account or sign in to comment

You need to be a member in order to leave a comment

Create an account

Sign up for a new account in our community. It's easy!

Register a new account

Sign in

Already have an account? Sign in here.

Sign In Now
  • Blog Statistics

    • Total Blogs
      3
    • Total Entries
      2,822
  • Latest Forum Topics

  • Our picks

    • International Workers' Day & Early May Trading Hours
      Please be advised that our opening hours will be adjusted on 1 May 2024 for International Workers’ Day and 6 May 2024 for the UK Early May Bank Holiday. Where appropriate, the times listed are in GMT.
        • Like
    • Are these the best AI stocks to watch in May 2024?
      Microsoft, Apple, Nvidia, Amazon and Meta could be the best AI stocks to watch next month. These stocks are the largest AI stocks in the US based on market capitalisation.
    • Natural Gas Commodity Elliottwave Technical Analysis
      Natural Gas


      Mode - Impulsive 


      Structure - Impulse Wave 


      Position - Wave (iii) of 5


      Direction - Wave (iii) of 5 still in play


      Details:  Price now in wave iii as it attempts to breach 1.65 wave i low. Wave (iii) is still expected to extend lower in an impulse.


      Natural Gas is currently breaching the previous April low, marking a decisive move as the impulse initiated on 5th March continues its downward trajectory, further extending the overarching impulse wave sequence that commenced back in August 2022. This decline is anticipated to persist as long as the price remains below the critical resistance level of 2.012.


      Zooming in on the daily chart, we observe the medium-term impulse wave originating from August 2022, which is persisting in its downward trend after completing its 4th wave - delineated as primary wave 4 in blue (circled) - at 3.666 in October 2023. Presently, the 5th wave, identified as primary blue wave 5, is underway, manifesting as an impulse at the intermediate degree in red. It is envisaged that the price will breach the February 2024 low of 1.533 as wave 5 of (3) seeks culmination before an anticipated rebound in wave (4). This confluence of price movements underscores the bearish sentiment prevailing over Natural Gas in the medium term.


      Analyzing the H4 chart, we initiated the impulse wave count for wave (3) from the level of 2.012, which marks the termination point of wave 4. Notably, price action formed a 1-2-1-2 structure, with confirmation established at 1.65 and invalidation set at 2.012. The confirmation of our anticipated direction materialized as price breached the 1.65 mark, signifying a resumption of bearish momentum. Presently, there appears to be minimal resistance hindering the bears, thereby reinstating their dominance in the market. It is projected that wave iii of (iii) of 5 will manifest around 1.43, indicative of the potential for the wave 5 low to extend to 1.3 or even lower. This comprehensive analysis underscores the prevailing bearish outlook for Natural Gas in the immediate future.


      Technical Analyst : Sanmi Adeagbo
       
        • Like
×
×
  • Create New...
us