Canadian Dollar Down on CPI and Yields as Risk Turns Off. Will USD/CAD Keep Rising?

Entry posted by MongiIG in Market News
2,412 views
CANADIAN DOLLAR, US YIELDS, CRUDE OIL, NZD/USD, AUD/USD - TALKING POINTS:
- The Canadian Dollar got hit by bond traders’ expectations being disappointed.
- APAC equities were listless, undermined after a risk-off sentiment lead from the US.
- Crude oil fell, gold held and commodity currencies softened. Where to for USD/CAD?

The Canadian Dollar dropped after CPI hit expectations. This disappointed domestic bond bears and rates there went lower to aid CAD depreciation. Canadian 10-year government bond yields went from a high of 1.81% to a low of 1.69%.
US yields also dragged lower, with 10-year Treasuries backing away from a high of 1.65% to trade at 1.58% at one stage. 30-years went from above 2.04% to trade below 1.97%.
With yields heading south, gold found some luster and held the gains from the US session in Asia.
US equities gave APAC stocks a soft lead as they closed down a bit overnight after some earnings misses. Mainland China’s CSI 300, Hong Kong’s Hang Seng Index (HSI) and Japan’s Nikkei 225 were weaker. Australia’s ASX 200 index finished slightly up.
With equities sliding and growth assets looking less rosy, crude oil slid lower in the US session and continued lower through the far east. Speculation continued to swirl about the US dipping into its Strategic Petroleum Reserve.
In addition, OPEC+ have previously said that they believe production will be significantly higher into the earlier part of 2022. A report overnight from the US Energy Information Administration (EIA) concurs with this outlook.
The Australia and New Zealand Dollars were sold overnight with other risk assets but were the better performers in Asia today.
The Kiwi got a boost from the Reserve Bank of New Zealand’s inflation expectations data hitting a 10-year high. This led to speculation of a 50-basis point hike from the RBNZ next week.
Looking ahead, there are a number of ECB and Fed speakers, as well as US jobless claims data.
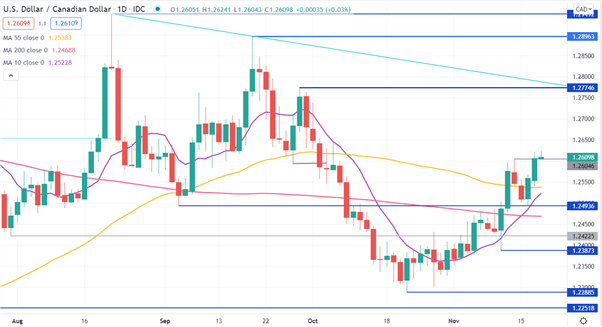
USD/CAD TECHNICAL ANALYSIS
USD/CAD has rallied through the previous high of 1.26046 and the 10, 55 and 200-day simple moving averages (SMA) might be about to signal further bullish momentum.
A bullish triple moving average (TMA) formation requires the price to be above the short term SMA, the latter to be above the medium term SMA and the medium term SMA to be above the long term SMA. All SMAs also need to have a positive gradient.
There are two outstanding requirements for a bullish TMA in USD/CAD. The 10-day SMA needs to be above the 55-day SMA and the gradient of the 200-day SMA needs to turn to positive. If the price remains above the 10-day SMA, this may unfold.
Resistance could be at the previous highs of 1.27746, 1.28963 and 1.29492. On the downside, potential support may lie at the pivot point of 1.24936 or the prior lows of 1.23873, 1.22885 and 1.22518.
Written by Daniel McCarthy, Strategist for DailyFX.com. 18th November 2021


0 Comments
Recommended Comments
There are no comments to display.
Create an account or sign in to comment
You need to be a member in order to leave a comment
Create an account
Sign up for a new account in our community. It's easy!
Register a new accountSign in
Already have an account? Sign in here.
Sign In Now