British Pound (GBP) Price Outlook: GBP/USD Brushes Off Government Setback

Entry posted by MongiIG in Market News
819 views
GBP PRICE, NEWS AND ANALYSIS:
- GBP/USD looks to be stabilizing after its losses over the past few sessions caused principally by US Dollar strength.
- So far, the pair has largely ignored setbacks for UK Prime Minister Boris Johnson but there’s a risk that it could suffer further if the pressures on him continue to grow.

GBP STEADIES BUT FURTHER LOSSES POSSIBLE
GBP/USD looks to be stabilizing after the slide that has taken it from a recent high at 1.3518 recorded on November 18 to current levels around 1.3375. That slide was due principally to US Dollar strength on suggestions that the US could speed up its tapering of monetary assistance after the re-nomination of Jay Powell as Chair of the Federal Reserve.
So far, there has been little response in the markets to problems for the UK Prime Minister but there is still a risk that if the pressures on Boris Johnson should grow then the Pound will suffer correspondingly.
GBP/USD PRICE CHART, ONE HOUR TIMEFRAME (NOVEMBER 17-24, 2021)
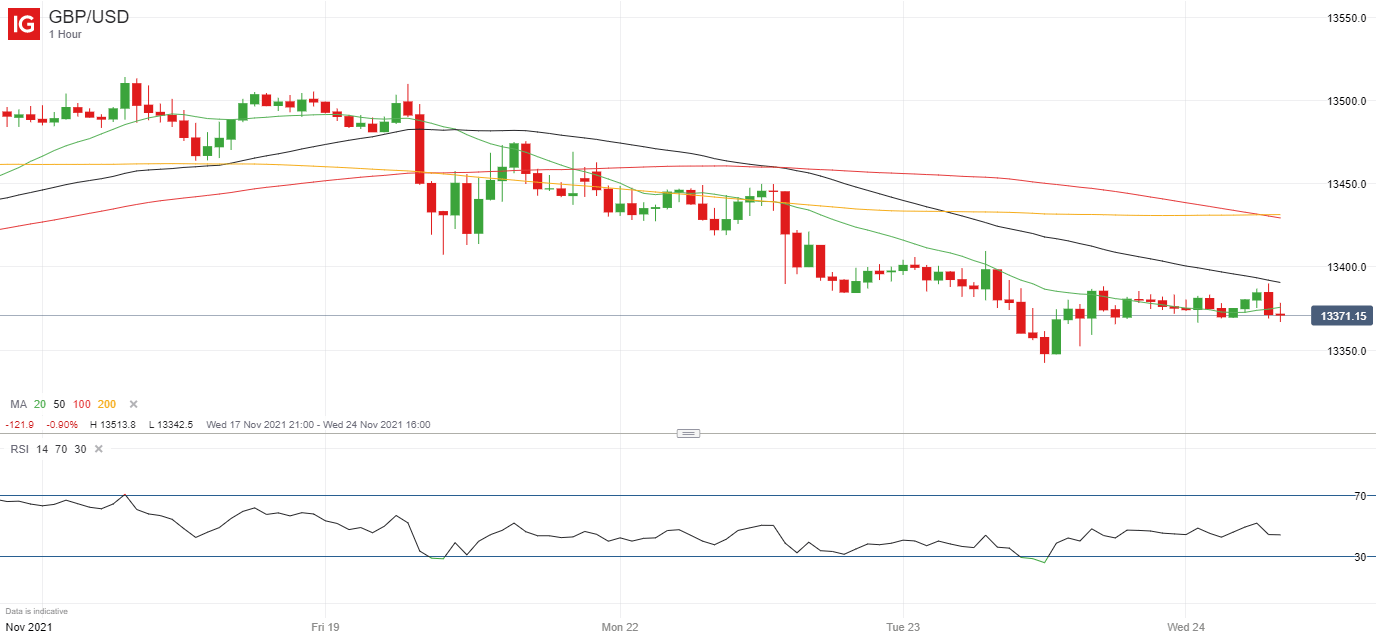
Source: IG (You can click on it for a larger image)
UK GOVERNMENT COMES CLOSE TO DEFEAT
In the news, Johnson faced a sizeable rebellion by his ruling Conservative Party in a vote Monday by the House of Commons on a controversial social care bill that is expected to be amended in the House of Lords. He has also been ridiculed for a speech at the CBI, the main UK employers’ organization, in which he lost his place and praised the cartoon character Peppa Pig.
Arguably, that’s less important for GBP/USD traders than an expected increase in UK interest rates next month. However, if Johnson is seen to be losing his grip on the policy agenda then GBP/USD could well resume its decline.
Note too that EUR/GBP is steadying after its recent falls despite concerns about the spread of coronavirus cases in Western Europe and protests in several countries over proposed new restrictions being introduced as a result.
That too suggests the British Pound is being held back not only by US Dollar strength but also by concerns about the political pressures on the UK Government.
EUR/GBP PRICE CHART, ONE HOUR TIMEFRAME (NOVEMBER 5-24, 2021)
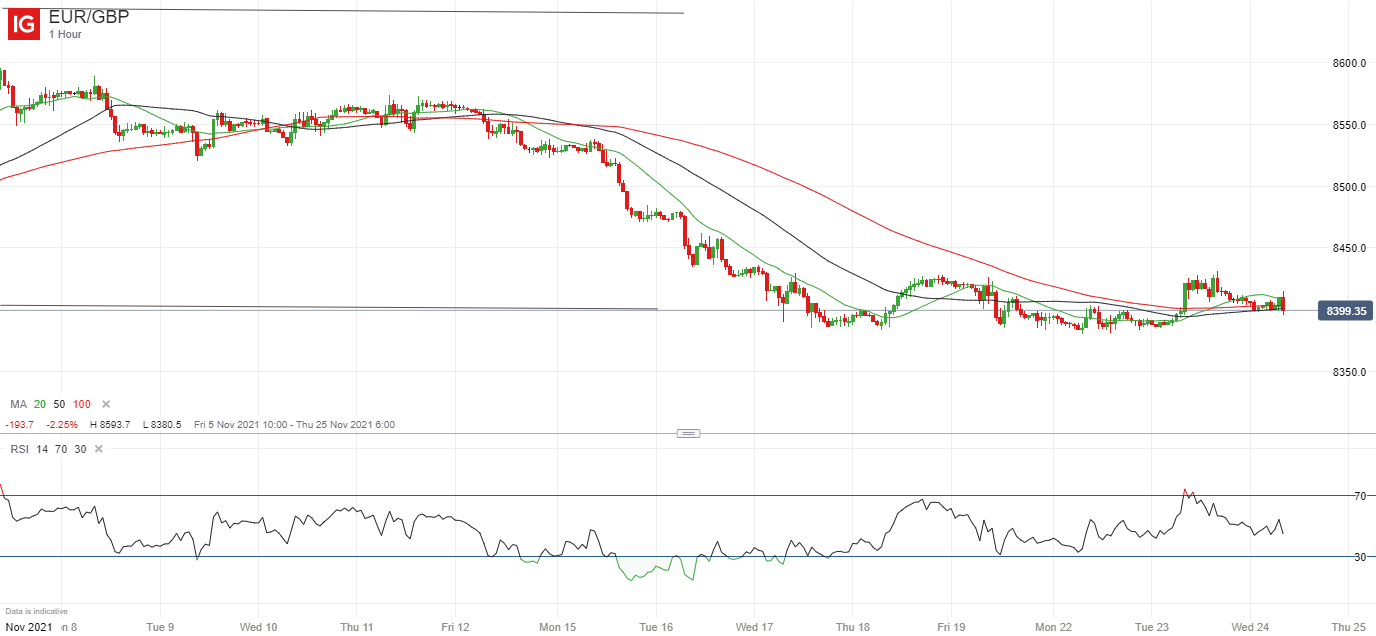
Source: IG (You can click on it for a larger image)
Written by Martin Essex, Analyst, 24th November 2021. DailyFX


0 Comments
Recommended Comments
There are no comments to display.
Create an account or sign in to comment
You need to be a member in order to leave a comment
Create an account
Sign up for a new account in our community. It's easy!
Register a new accountSign in
Already have an account? Sign in here.
Sign In Now