Crude Oil Heats Up Ahead of OPEC+ And Post FOMC Minutes. Will WTI Break Higher?

Entry posted by MongiIG in Market News
1,448 views
CRUDE OIL, OPEC+, US DOLLAR, FOMC, USD/JPY, EUR/USD - TALKING POINTS:
- WTI crude prices settle in as competing interests voice their views.
- US Dollar strengthens in the aftermath of data and FOMC minutes.
- Price action could get skittish with holiday liquidity. Can oil reignite?
Crude oil steadied overnight after jawboning from both producers and consumers hit the wires. An advisory panel to OPEC+ (The Economic Commission Board) said that extra supply from various strategic stockpile reserves would bloat supply. Member states have this week said that they might reduce output if reserves were tapped.
Meanwhile the US International Energy Agency accused producers of creating artificial tightness in energy markets. WTI crude saw a tight range of US4 78.24 – 78.65 in the Asian session. OPEC+ will be meeting next Thursday to discuss production.
The US Dollar was stronger across most markets again today. A plethora of US data overnight was viewed as mainly positive and the FOMC meeting minutes were interpreted by the market to be quite hawkish.
The result was a flattening of the Treasury curve with the yield on 1 and 2-year notes edging higher while 10 and 30-years slid a few basis points (bp).
The Bank of Korea raised rates 25 bp to 1.00% today. Governor Lee Ju-yeol said that he saw significant issues with inflation from the demand side. “Team transitory” at the Fed see the current eye-popping inflation as a supply side issue.
Bottlenecks in the supply chain are sighted as the cause of transitory inflation. The market is starting to price a more aggressive Fed after a number of FOMC members have recently made hawkish comments.
The latest was San Francisco Fed President Mary Daly. Last night she said that she could see the pace of tapering speeding up. Ms Daly is considered dovish by the market.
USD/JPY made another 4-year high in the US session at 115.46, just shy of the March 2017 peak of 115.51. EUR/USD made a new low for the year at 1.1186 and spent the Asia session a few ticks either side 1.1200.
APAC equities were mixed today, following on from the theme on Wall street. Hong Kong and Chinese indices were a bit weaker while Australia, South Korea, Japan and New Zealand bourses edged up to varying degrees.
It could be a quiet day ahead due to the Thanksgiving holiday in the US. However, there are a lot of ECB speakers today. BoE Governor Andrew Bailey is also due to give a speech.
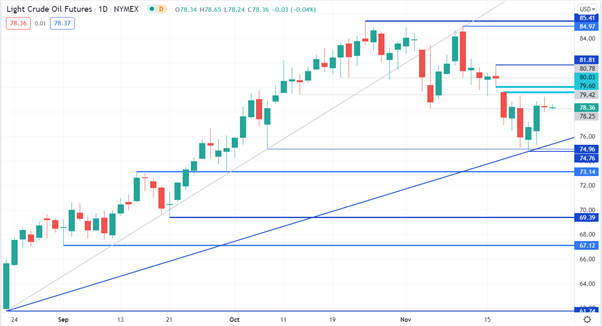
CRUDE OIL TECHNICAL ANALYSIS
Last week saw a gap in the price action. The gap can be observed between the low on Tuesday 16th November at 80.03 and the high the following day of 79.71.
Markets sometimes have a tendency to ‘fill in the gap’. This might occur for WTI. It should be noted though that past performance is not indicative of future results.
Resistance could be at the previous highs of 81.81 and then further up at 84.97 and 85.41. On the downside, potential support may lie at the recent low of 74.96 or a pivot point at 73.14.
Written by Daniel McCarthy, Strategist for DailyFX.com. 25th November 2021.


0 Comments
Recommended Comments
There are no comments to display.
Create an account or sign in to comment
You need to be a member in order to leave a comment
Create an account
Sign up for a new account in our community. It's easy!
Register a new accountSign in
Already have an account? Sign in here.
Sign In Now