The Importance of Liquidity in Forex Trading

- Reviewed by James Stanley, Nov. 24, 2021
As a trader gets started in forex trading, one of the first advantages they’re likely to come across is how much liquidity the forex market offers over other markets. The latest figures are roughly $5.1 trillion in daily traded volume as per the Bank of International Settlements triennial report of 2016.
Forex liquidity allows for ease of trade, making the market popular among traders. However, certain variances in the FX market need to be taken into consideration for liquidity purposes. This article will explain the concept of forex liquidity as well as liquidity risk, ultimately seeking to provide an overall understanding of how liquidity affects trading.
WHAT IS LIQUIDITY AND WHY IS IT IMPORTANT?
Liquidity in the forex market is by definition, the ability of a currency pair to be traded (bought/sold) on demand. When you’re trading major currency pairs, you’re trading a market that is exceedingly liquid. However, you are trading based on the available liquidity of financial institutions which get you in or out of the trade (currency pair) of your choosing.
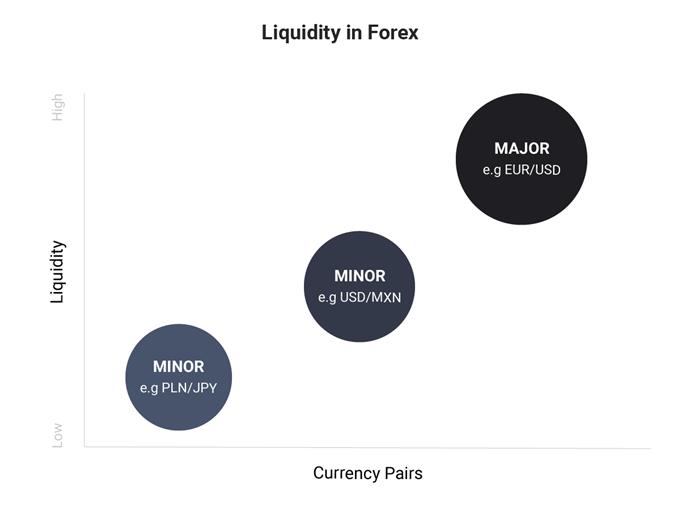
Not all currency pairs are liquid. In fact, currencies tend to have varying levels of liquidity depending on whether they are major, minor and exotic pairs (including emerging market currencies). Forex liquidity dries up as trader’s move from major pairs to minor pairs and finally to the exotic pairs.
High Liquidity:
High liquidity in forex refers to a currency pair that can be bought/sold in significant sizes without large variances in its exchange rate (price level) – e.g. Major currency pairs such as EUR/USD.
Other major currency (highly liquid) pairs to be aware of:
Low Liquidity:
Low liquidity in forex refers to a currency pair that cannot be bought/sold in significant sizes without large variances in its exchange rate price level – e.g. Exotic currency pairs such as PLN/JPY.
FOREX LIQUIDITY VS ILLIQUIDITY: 3 SIGNS TO LOOK OUT FOR
From a trader’s point of view, an illiquid market will have chaotic moves or gaps because the level of buying or selling volume at any one moment can vary greatly. A highly liquid market is also known as a deep market or a smooth market and price action is also smooth. Most traders need and should require a liquid market because it is very hard to manage risk if you’re on the wrong side of a big move in an illiquid market.
Here are three signs to look out for which are:
1. GAPS WHEN TRADING FOREX
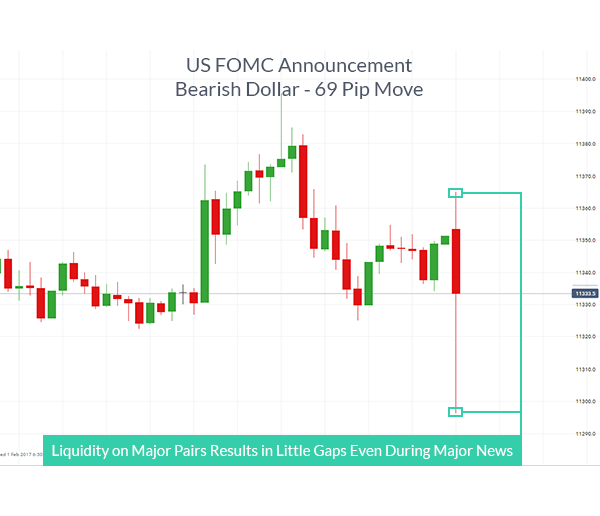
Gaps in forex vary compared to other markets. However, price gaps can occur in forex if an interest rate announcement or other high impact news announcement comes out against expectations.
Gaps can occur at the week’s opening on Sunday afternoon in the US. If there is a news announcement over the weekend, then overall gaps in forex are usually less than a 0.50% of a currency’s value.
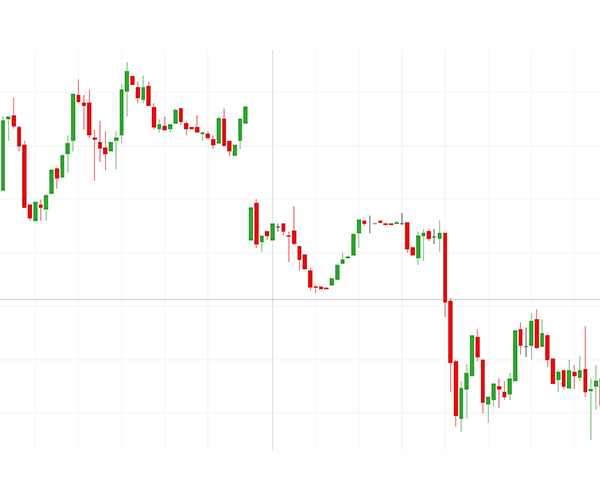
The charts below depict the difference in the liquidity between the equity market and the forex market, as highlighted by gapping.
Equity markets are prone to gaps: FTSE 100 Index
Forex market exhibits little/no gapping:
A market that trades 24 hours a day like the forex market is consideredmore liquid or simply tends to have less gaps due to the continuous naturein the equities market. This allows traders to enter and exit the market at their discretion. A market that only trades for a fraction of the day like the US Equity market or Futures Exchange would be condensed into a thinner market because price can jump at the open if overnight news comes out against the crowd’s expectations.
2. THE FOREX LIQUIDITY INDICATOR
Brokers often offer a “volume” option on the chart whereby a trader can gauge the liquidity of the market. This forex liquidity indicator is interpreted by analysing the bars on the volume chart.
Each volume bar represents the volume traded during the specific time period, thus giving the trader a suitable approximation of liquidity. It is important to remember that most brokers only reflect their own liquidity data and not the overall forex market liquidity. However, using a broker’s liquidity as a gauge can represent the retail market fittingly depending on the size of the broker.
3. DIFFERENT TIMES OF DAY OFFER VARYING AMOUNTS OF LIQUIDITY
Short term traders or scalpers should be aware of how liquidity in forex varies through the trading day. There are less active hours like the Asian Session that is often range bound meaning support and resistance levels are more likely to hold from a speculation point of view. The major moving market sessions such as the London session and US session are more prone to breakouts and larger percentile moves on the day.
The time of day that you’re likely to see the biggest moves are the US Morning Session because it overlaps with the European / London Session which alone accounts for roughly +50% of total daily global volume. The US session alone accounts for around 20% and in the US Afternoon, you will often see a sharp drop off in aggressive moves except for when the Federal Open Market Committee (FOMC) comes out with a surprise announcement which is but a few times a year.
LIQUIDITY RISK VS REWARD
The relationship between risk and reward in financial markets is almost always proportionate, so understanding the risks involved in a trade must be taken into consideration.
A primary example of liquidity risk in the forex market is the Swiss Franc crisis in 2015. The Swiss central bank announced they would no longer be preserving the Swiss Franc peg against the Euro causing the interbank market to become broken due to an inability to price the market. This led to brokers being unable to offer liquidity on CHF. As interbank pricing (the backbone of forex pricing) returned, EUR/CHF prices were far from the previous range. This led to retail client account balances for those trading CHF to be largely affected. While these “Black Swan” events are rare, they are not impossible.
Retail forex traders need to manage these liquidity risks by either lowering their leverage or making use of guaranteed stops whereby the broker is obligated to honour your stop price level.
Weighing up the options between liquidity risk and reward should not be overlooked and should be included as a part of a trader’s analysis routine.
FURTHER READING TO TAKE YOUR FOREX TRADING TO THE NEXT LEVEL
- The forex market has evolved over centuries. For a summarized account of the most important developments shaping this $5 trillion-a-day market, read more on the history of forex.
- Our research team analyzed over 30 million live trades to uncover the traits of successful traders. Incorporate these traits to give yourself an edge in the markets.
- Traders often look to retail client sentiment when trading popular FX markets. DailyFX provides such data, based on IG client sentiment.
- If you are just starting out on your trading journey, it is essential to understand the basics. Download our free New to Forex trading guide.
By Warren Venketas, Analyst, 26th November 2021. DailyFX


.jpeg.98f0cfe51803b4af23bc6b06b29ba6ff.jpeg)
0 Comments
Recommended Comments
There are no comments to display.
Create an account or sign in to comment
You need to be a member in order to leave a comment
Create an account
Sign up for a new account in our community. It's easy!
Register a new accountSign in
Already have an account? Sign in here.
Sign In Now