McDonald's Q4 earnings: will the fast-food king continue to beat the forecast?

Entry posted by MongiIG in Market News
671 views
McDonald's Corporation will report its fourth quarter (Q4) earnings on January 27th, before the market opens. The report will be for the fiscal quarter ending December 2021.
 Source: Bloomberg
What to expect
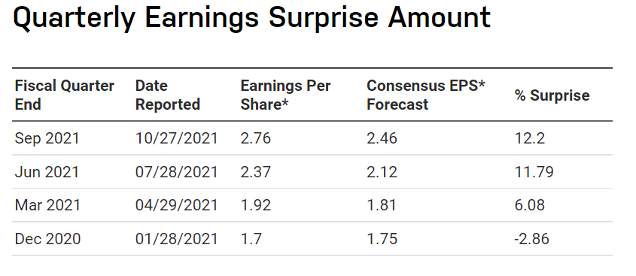
According to Zack's Investment Research, based on 13 analysts' forecasts, the consensus earnings per share (EPS) forecast for the quarter is $2.31, up by 37.6% from EPS of $1.70 one year ago.
Based on this forecast, McDonald's will record a 16% drop in EPS; however, it is still in line with the fast-food giant's seasonal pattern. Revenue is forecast to climb 13.5% year-over-year to $6.03 billion, benefitting from higher menu prices, a successful digital loyalty program, and the regional boost.
In its third quarter (Q3 )earnings, McDonald's internationally operated markets segment saw its same-store sales rise 13.9% from the previous year, fuelled by recovered demand after Covid restrictions eased in the United Kingdom, Canada, France, and Germany. As a result, there's good reason to believe that same-store sales in countries like Australia and Japan will show significant rebound in the fourth quarter (Q4) when these nations come out of lockdown.
Based on all the earnings reported in 2021, McDonald's rarely let its shareholders down. Earnings from quarters two and three successfully beat the forecast by double digits. Hence, market participants expect McDonald's to continue its outstanding record in Q4 and outperform its pre-Covid levels amid the new Omicron variant.
 Source: Nasdaq
Key points to watch:
• Pricing power
• Labour shortages
• Impact of Omicron
From a macro point of view, inflation is believed to be a major risk and a vital test for every company's ongoing profitability.
From the last quarter's report, we can see that the leading burger and chips makers' menu prices have increased by 6% annually. The question is whether McDonald's can continue to exercise its pricing power when its home country's inflation rate grew at the fastest pace in 30-years to offset increased labour and commodity costs.
Staffing shortages are another concern. It was reported that some of the chain's restaurants scaled back their late-night hours and understaffed some locations which has put pressure on McDonald's speed of service and sales volume. Therefore, the outlook for the months ahead will be in focus as investors are keen to know how the fast-food giant will deal with worries surrounding staffing shortages considering the fact that Omicron continues to proliferate the labour crisis.
Technical analysis
McDonald's continues to reward its investors with a robust return. Since early 2021, its share price has grown by 24.6%. The prospect for its price also looks strong as the market is making the shift to favour value stocks under the tighter monetary environment.
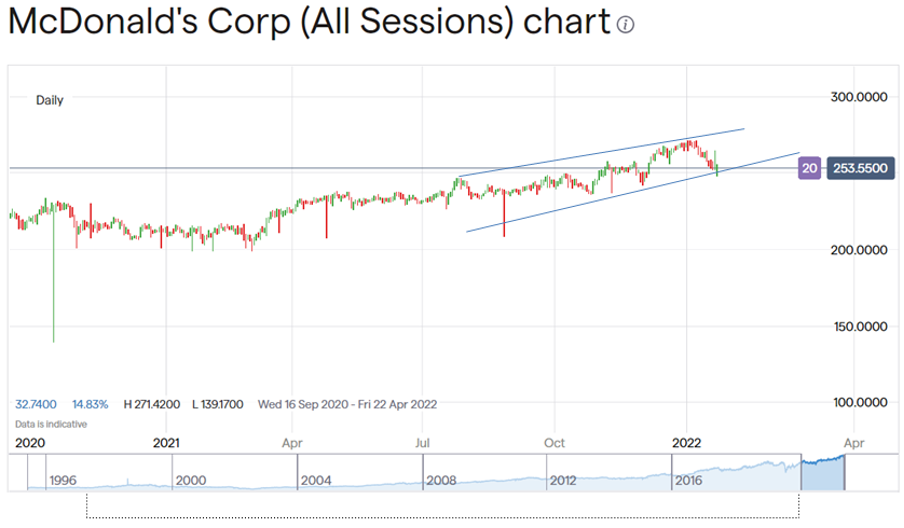
From a technical standpoint, MCD has pulled back 7% from its all-time high of $271.15 recorded on 4 January.
Despite recent losses, the price remains in the ascending wedge above the 100 day moving average, suggesting the long-term uptrend will remain unchanged.
For the short-term outlook, the current major level of support comes in at around $253, a break of which sees $249 as a possible turning point for the price to head south.
However, an up-turned RSI indicator from the oversold territory and the increased trading volume last week can both be viewed as a bullish sign.
 Source: IG charts


0 Comments
Recommended Comments
There are no comments to display.
Create an account or sign in to comment
You need to be a member in order to leave a comment
Create an account
Sign up for a new account in our community. It's easy!
Register a new accountSign in
Already have an account? Sign in here.
Sign In Now