Exxon trades at all-time highs after largest profit in 7 years

Entry posted by MongiIG in Market News
1,159 views
Where to next for the Exxon Mobile share price following its biggest profit in seven years on high oil and gas prices?
 Source: Bloomberg
Exxon Mobil Corp (XOM) beat estimates on Tuesday when the company reported a fourth quarter (Q4) profit of $8.87 billion, its largest in seven years, as it benefited from soaring energy prices.
The oil producer’s revenue increased by over 80% year-on-year during Q4, putting it in a stronger financial position to begin to buy back stock during the first quarter and leading to its share price rising by over 6% on Tuesday.
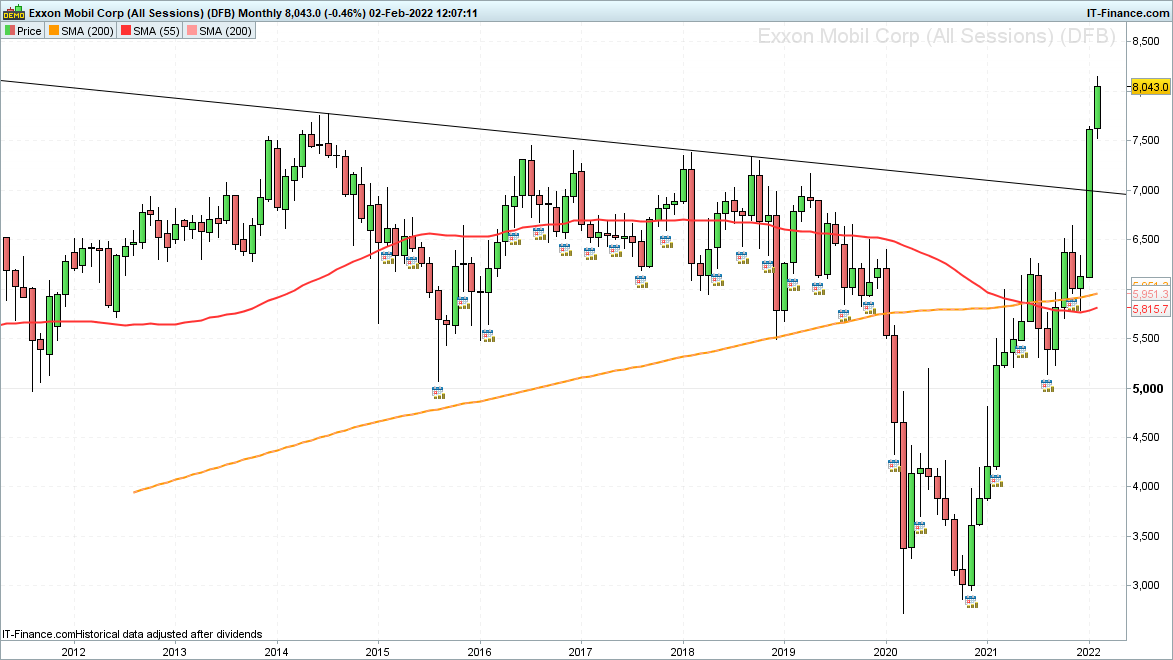
Year-to-date the share price has soared by over 25% and over the past year by over 75%. With Exxon now trading in all-time highs so far at $81.50, the question is where is the share price going to head to next?
 Source: ProRealTime
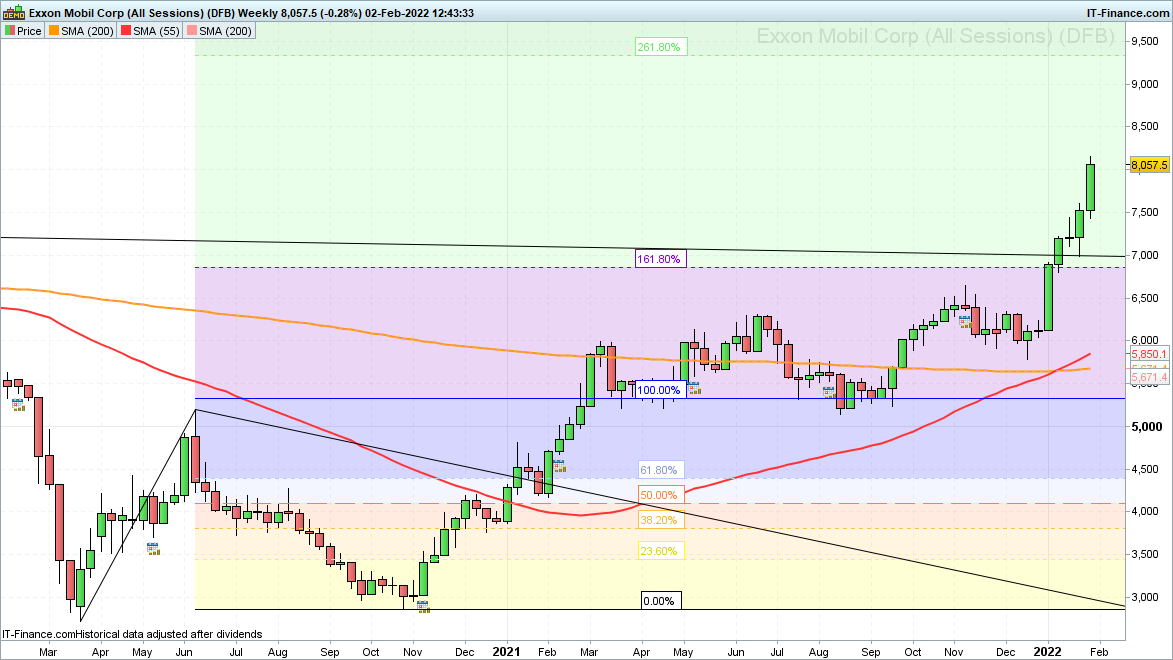
The first technical upside target can be found by plotting a Fibonacci expansion of the October 2020 to June 2021 advance from the August 2021 low which comes in at $85.85. It is where the distance of the advance seen since August 2021 equals that of the October 2020 to June 2021 rise.
 Source: ProRealTime
Further up sits a 261.8% Fibonacci extension of the March-to-June 2020 advance, projected higher from the October 2020 low. This is to say that 2.618 times the distance of the March-to-June 2020 rise is projected higher from the October 2020 low point. The Fibonacci extension can be spotted at $93.30.
 Source: ProRealTime
Financial markets are frequently drawn to these Fibonacci expansions and extensions when trading in uncharted waters such as in new all-time highs, just as they are to round numbers. One such round number and upside target can be found at the psychological $100 mark.
Human beings like to talk about and easily remember round numbers, such as the unfortunate 100,000, and this year the 150,000, Covid-19 death thresholds frequently mentioned by the UK media during the pandemic. Since human emotions, such as greed, hope and fear, to a large extent drive financial markets, it is not surprising that these also tend to gravitate towards round numbers, both to the up- and downside.
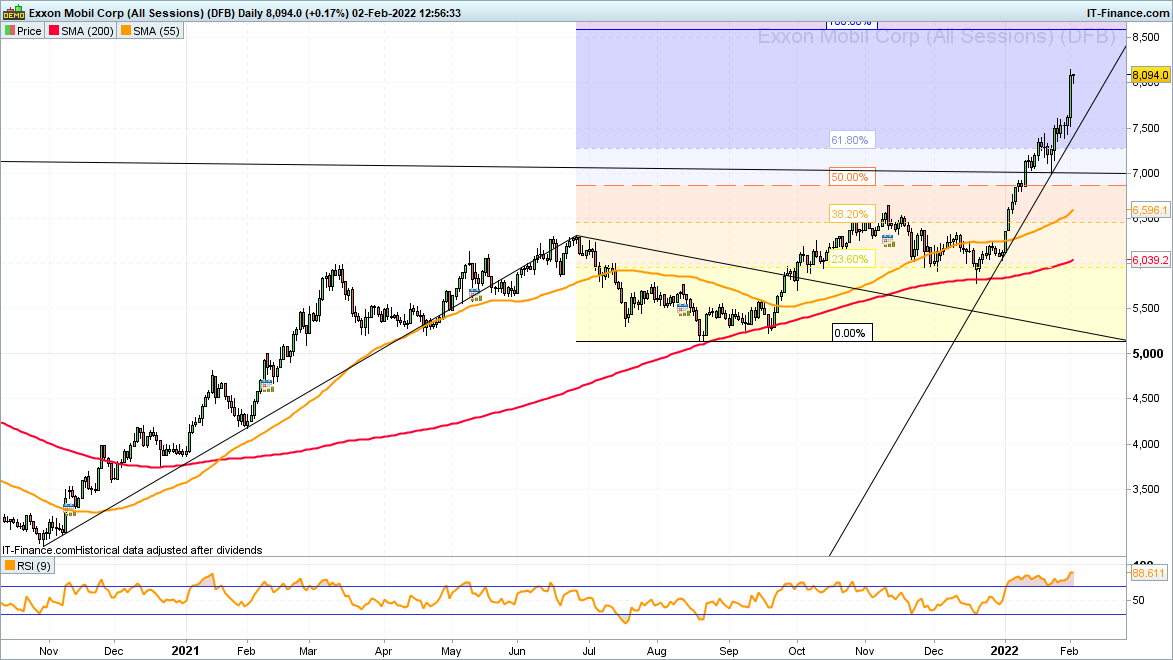
It may take a while for the above-mentioned upside targets to be reached but as long as the steep two-month uptrend line at $74.20 underpins, the bulls will remain firmly in control. Only a slip through the last swing-low on the daily chart seen on 24 January at $69.81 would neutralise the short-term bullish outlook.


0 Comments
Recommended Comments
There are no comments to display.
Create an account or sign in to comment
You need to be a member in order to leave a comment
Create an account
Sign up for a new account in our community. It's easy!
Register a new accountSign in
Already have an account? Sign in here.
Sign In Now