BP expected to build on gains around Q4 results

Entry posted by MongiIG in Market News
475 views
BP gives technical buy signal ahead of fourth quarter earnings on Tuesday.
 Source: Bloomberg
The BP plc share price started the year on a strong footing and has risen close to 15% year-to-date, mirroring the advance in the oil price.
Ahead of its fourth quarter earnings, out tomorrow, it may be of interest to investors to have a closer look at the technical picture.
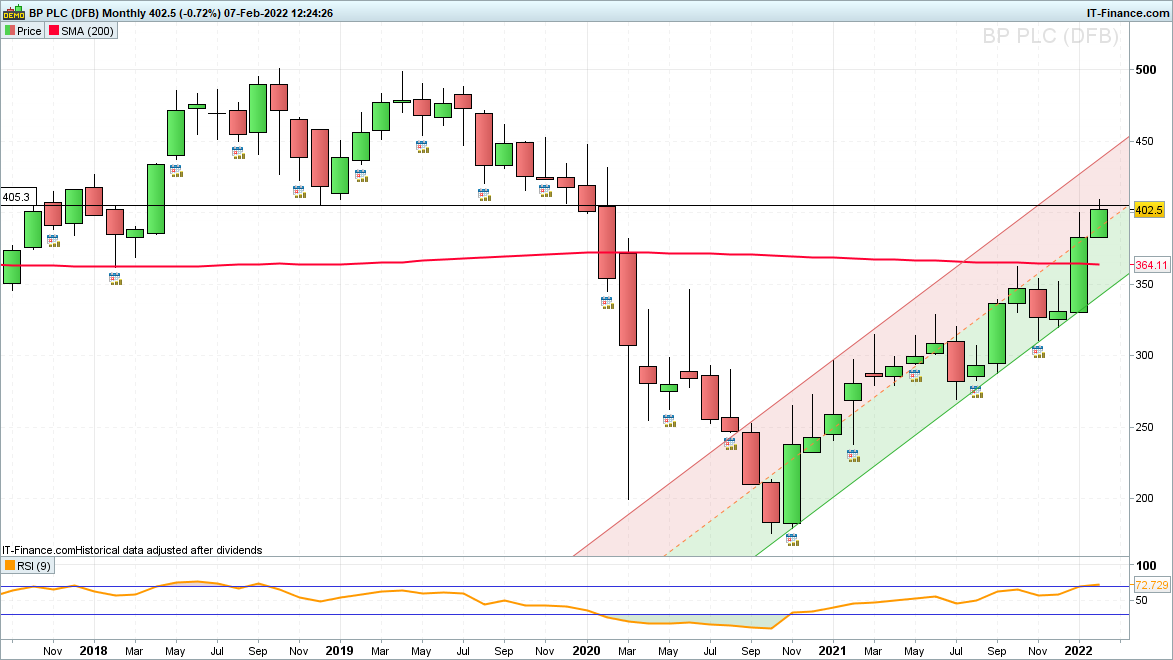
On the monthly chart the BP share price has evolved in a clear uptrend channel since October 2020 and in January of this year rose sharply above the 200-month simple moving average (SMA) at 364.10 which bodes well for the bulls.
 Source: ProRealTime
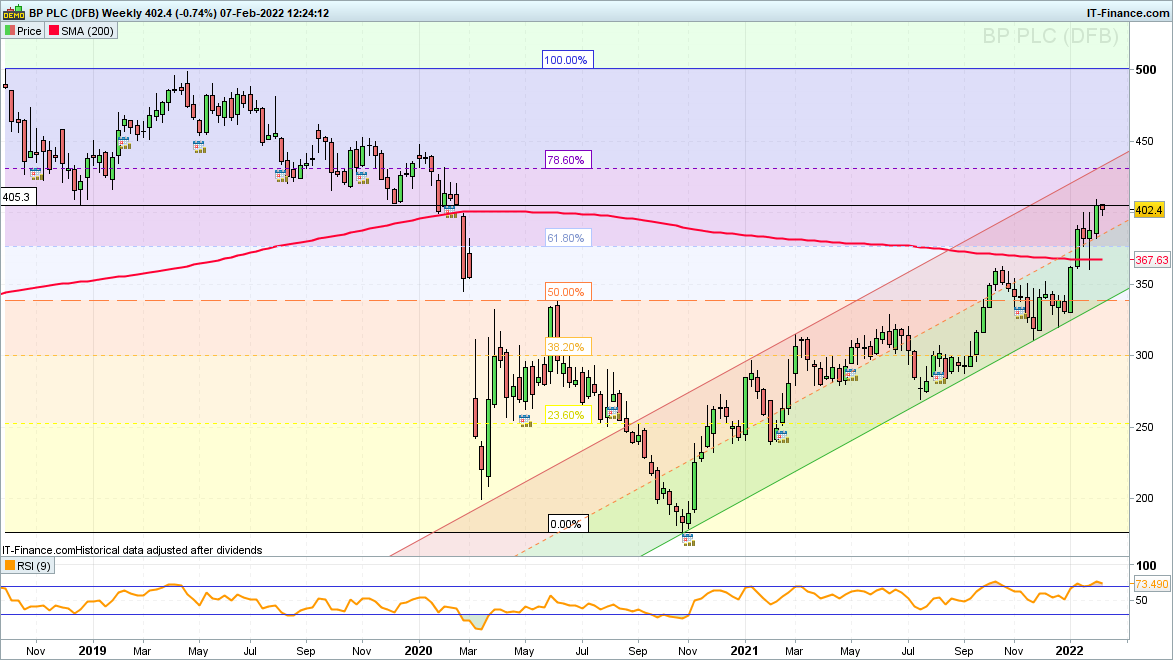
Last week, BP hit a two-year high at 409.20 before slipping back to the psychological 400 mark earlier today.
This should not have come as a surprise to those who analyse the share price from a technical perspective since the area around the December 2018 and 2019 troughs at 405.30 to 406.20 acted as resistance and a temporary stop.
 Source: ProRealTime
The longer-term bullish technical picture will remain valid while the BP share price stays above the 200-week SMA, October 2021 high and late January low at 367.62 to 360.00.
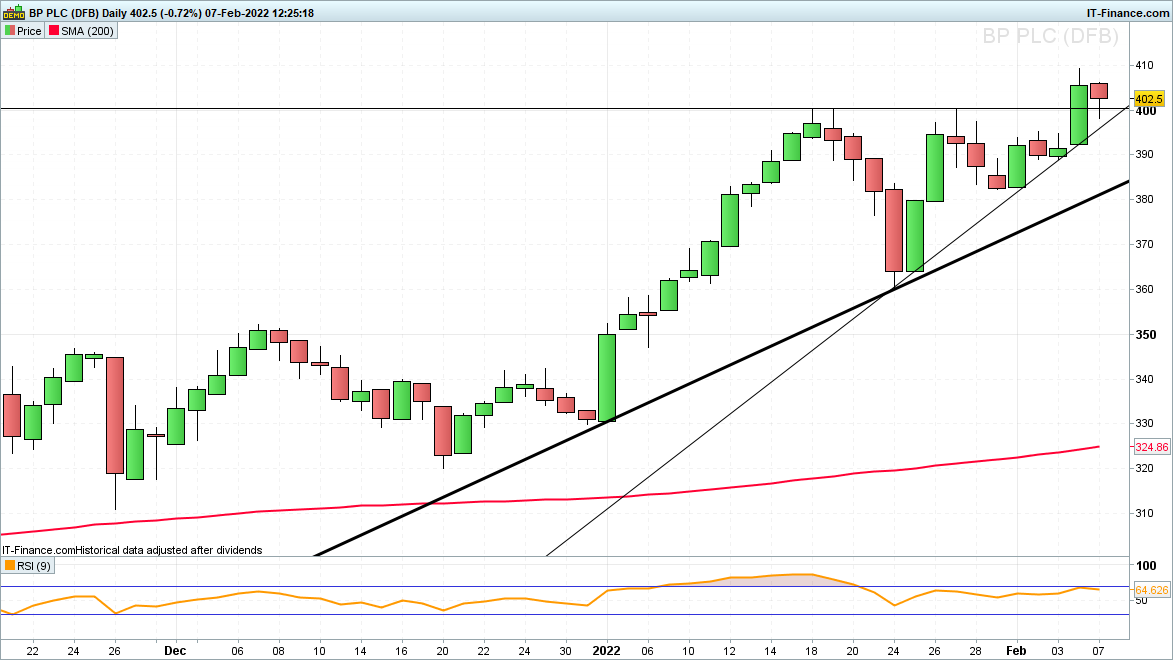
On the shorter-term daily chart, a bullish breakout above the psychological 400 mark and the mid- and late January highs at 400.40 occurred last week which provoked the rally to its current two-year high at 409.20 to date.
Technically speaking such a break higher is bullish since it has taken out previous resistance. This is currently being revisited but should now, because of inverse polarity, act as support.
 Source: ProRealTime
Shorter-term traders may thus wish to enter the fray and could join those who are already long but would need to perhaps place a stop-loss order below the late January swing-low and two-month tentative uptrend line at 382.30 to 381.20.
A potential technical upside target area comes in between the 78.6% Fibonacci retracement of the 2018 to 2020 decline and the 2020 to 2022 uptrend channel resistance line at 431.50 to 433.00. The 78.6% Fibonacci retracement is derived from the square root of 0.618 and some technical analysts look at it instead of the more commonly used 76.4% Fibonacci retracement.
Other potential upside targets sit at the January 2020 high at 447.70, the November 2019 high at 452.30 and the September 2019 peak at 461.80.
In the longer-term the psychological 500 mark, close to where the October 2018 and April 2019 highs were made, also offers a potential upside target.


0 Comments
Recommended Comments
There are no comments to display.
Create an account or sign in to comment
You need to be a member in order to leave a comment
Create an account
Sign up for a new account in our community. It's easy!
Register a new accountSign in
Already have an account? Sign in here.
Sign In Now