AUD/USD edges up as RBA ends QE

Entry posted by MongiIG in Market News
442 views
The Reserve Bank of Australia (RBA) conducted its final securities purchase on Thursday.
 Source: Bloomberg
The Reserve Bank of Australia (RBA) conducted its final securities purchase on Thursday (February 10th) according to the schedule of concluding quantitative easing (QE), which was confirmed at the Bank's last meeting.
After this purchase, the RBA will triple its balance sheet to about A$650 billion ($465 billion) and mark a new phase of Australia’s monetary policy. Despite all the uncertainly that lies ahead, the Australian currency pushed up firmly this week to mark a two-week-high, and more importantly, broke through a five-month-long downturn trendline.
Consumer sentiment and rate hike expectations
Even though the disruption from the Omicron variant has faded across central Australian states and the unemployment rate has dropped to the lowest level in 13 years, Australian consumers are more reluctant to spend compared to 12 months ago.
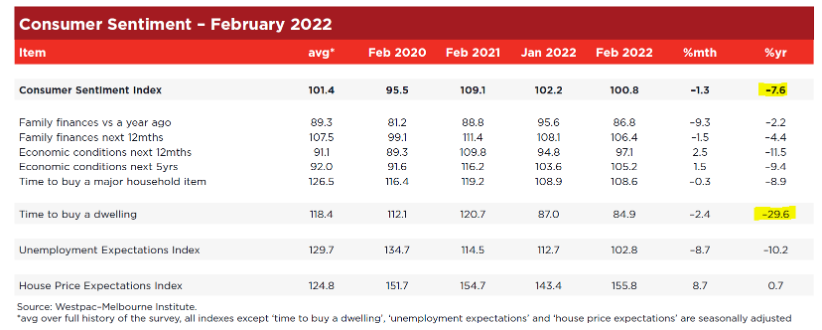
The Westpac-Melbourne Institute Index of Consumer Sentiment fell by 1.3% in February compared to January and was 7.6% lower than one year ago. The third straight month’s slip in consumer sentiment is believed to reflect rising concerns over the upcoming interest rate hike.
Data shows a firming expectation among Australian consumers that interest rates will rise soon: 66% of survey respondents expect an increase in mortgage rates over the next 12 months, up from 55% in January.
In particular, housing-related sentiment recorded a substantial drop (29.6%) to a near 14-year-low.
 Source: Westpac-Melbourne Institute
Iron ore price rebounds
The rebound of the price of iron ore could be one of the reasons the Aussie dollar is up by nearly 4% this month.
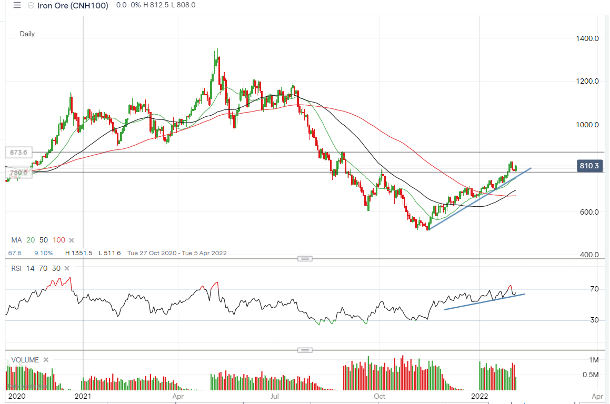
On Tuesday, Australia’s top export trading touched near a five-month high and moved toward the August high at around $157 per ton. Although Chinese authorities had placed new pressure on the iron ore market this week by warning to strengthen supervision and crack down on any irregularities, the price of iron ore keeps moving up after relatively mild retreats.
From a technical point of view, the mid-term uptrend since November remains valid despite the mid-week pullback. This is because of a series of higher highs and higher lows being visible on both the weekly and daily charts to support the view of a bull market.
RSI, a key indicator of investment sentiment, also recorded an uptrend with a series of high lows, meaning that eager buyers are dominating the market at the moment.
 Source: ProRealTime
AUD/USD - technical
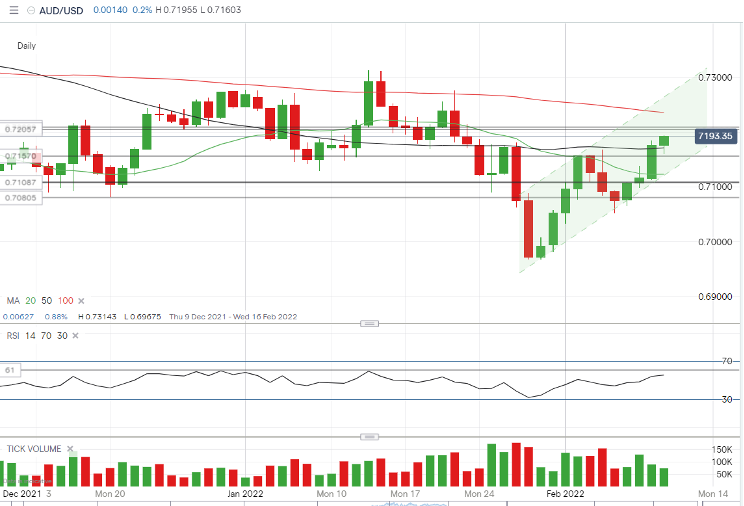
The Australian dollar has been up by nearly 4% since the start of February. After a surge lasting four straight days, AUD/USD is now trading above the 20 and 50-day moving averages (MA), which sits at 0.7163. The next target level for the pair will be the 100-day MA at 0.7248 before challenging the December high at 0.7275.
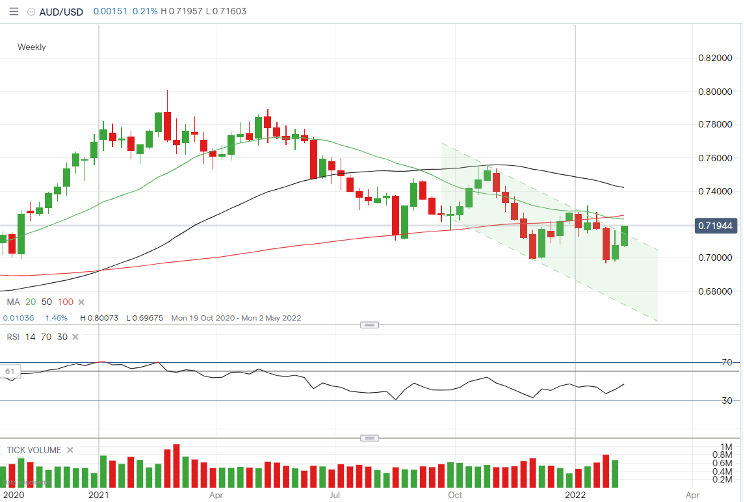
The weekly chart also shows an early sign of bulls as the pair has broken through the five-month downward channel, although the price remains under the 20, 50 and 100-week MAs.
Looking ahead to next week, if the price manages to close above 0.725, it will cement a bullish prospect. Current support sits near the 20-day simple moving average (SMA) around 0.7123, which, if broken through, will erase all the weekly gains and look at 0.7078.
 Source: ProRealTime
 Source: ProRealTime


.jpeg.98f0cfe51803b4af23bc6b06b29ba6ff.jpeg)

0 Comments
Recommended Comments
There are no comments to display.
Create an account or sign in to comment
You need to be a member in order to leave a comment
Create an account
Sign up for a new account in our community. It's easy!
Register a new accountSign in
Already have an account? Sign in here.
Sign In Now