Walmart Q4 earnings: what to expect

Entry posted by MongiIG in Market News
708 views
Walmart reports full-year and fourth quarter earnings on Thursday 17 February.
 Source: Bloomberg
What’s happening?
Walmart's fourth quarter (Q4) numbers on Thursday come before the US markets open. The chart is active all-sessions on the IG platform so can be traded when they are released.
Background
Walmart is one of the biggest retailers in the world and has a substantial presence both on Main Street and online.
During the year, Walmart has had to respond to the difficulties presented by the US government’s reaction to the pandemic. The company has mostly benefited as consumers spent more on goods and less on services and, of those goods purchased, much of the business went online.
Pre-pandemic, Walmart’s online offering was already strong and the company was able to shift further into the online business with little or no extra effort. The only issue was finding truck drivers available to deliver to fulfil demand. To ensure that happened, higher rates of pay were offered which has cut into the bottom line.
Now, with economies opening up again, shoppers are returning to stores. This has presented bricks and mortar retailers with another problem: an increase in staff illness as the Omicron variant of Covid-19 spreads freely amongst communities, leaving shop floors without sufficient numbers of staff.
Watch for YoY anomalies
The biggest change for Walmart, year-over-year (YoY), is that during 2021 it sold its operations in the UK, Japan and Argentina. Business Insider says that this has resulted in an 11% drop in net sales. This means that it will be more important than usual to look for adjusted numbers, for group sales and inventory levels, so that any comparisons are properly made.
Watch out, too, for the degree of disruption to supply chains. This has the effect of raising costs and one way for a retailer to mitigate these costs is to raise inventory.
Earnings expectations
Analysts are forecasting Q4 earnings per share (EPS) of $1.49 on revenues of $150.9 billion, according to a Zack's consensus estimate.
So far as the potential for a surprise, a Nasdaq market report points out that over the last four quarters, Walmart has beaten consensus EPS estimates three times.
For the third quarter of 2021, it was expected that Walmart would post earnings of $1.39 per share when it in fact produced earnings of $1.45, delivering a surprise of +4.32%.
If this is repeated, it may be an opportunity for traders to position for a potential upside market reaction.
Trading the Walmart chart
 Source: ProRealTime
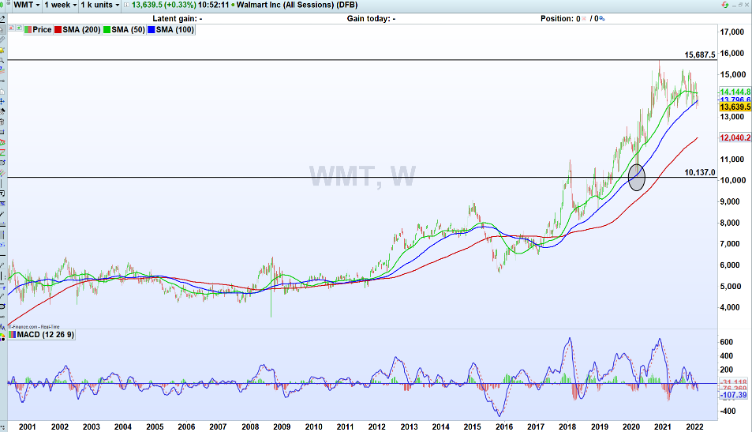
In this long-term weekly chart, the rise in Walmart stock since the turn of the century can clearly be seen.
The recent highs at $156.87 (an all-time record high for the stock), represented a climb of 54% from the Covid lows, highlighted on the chart in the ellipse at $101.37.
In this context many may say that the recent consolidation in the stock is no surprise.
 Source: ProRealTime
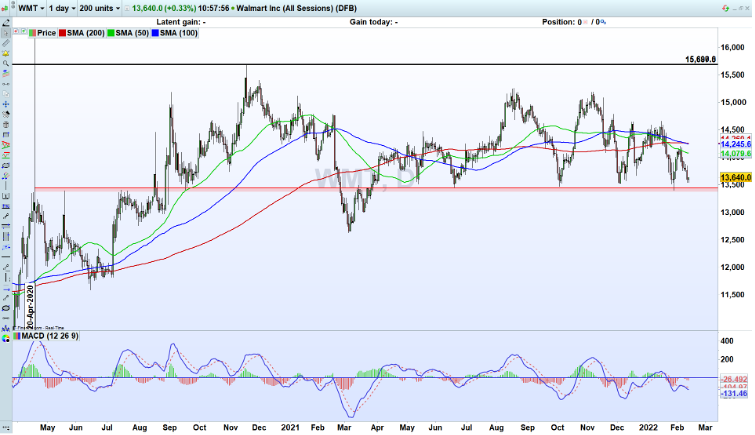
The second chart shows a red highlighted box which is acting as a supporting line for the shares of Walmart.
The box began life as a record high in April 2020 as it became obvious that an online presence was going to be critical in those early days of the pandemic. With people around the world being locked down and, in the US at least, Walmart was seen as one of the only serious competitors to Amazon’s online model.
That initial line of resistance then became support and now forms a line in the sand worth considering as a potential pivot point for traders. If you believe in the potential for Walmart to deliver another upside surprise, then you may be tempted into a long position on the stock chart and your stop-loss would go just below that box support at around $133. That support line was tested by that spike low from the hammer candle on 28 January this year.
However, the bottom line earnings are only part of the story. The company may well surprise, but the outlook will be critical. If there is any hint of a reduced outlook, for any one of a number of reasons, then the stock could drop below that area of support, falling to the March 2021 lows. If this is your belief then a short position may be the best bet with a stop-loss just over the $140 area.


0 Comments
Recommended Comments
There are no comments to display.
Create an account or sign in to comment
You need to be a member in order to leave a comment
Create an account
Sign up for a new account in our community. It's easy!
Register a new accountSign in
Already have an account? Sign in here.
Sign In Now