Asian markets lift despite Russian’s invasion, the bear trend remains

Entry posted by MongiIG in Market News
1,085 views
Asian markets were following a similar pathway as its US peers, just in smaller steps but the long-term bear trend remains valid.
 Source: Bloomberg
Russia’s attack on Ukraine has continued to shock the world. The Ukrainian president confirmed on Friday that several hundreds of Ukrainian civilians have been killed in Russia’s invasion. The US, UK, Australia, Germany, and Japan all announced new sanctions against Russia.
The equity market, however, made a surprise move after the previous day’s bloodbath. The US market also jumped significantly: Nasdaq increased by 3.25% and the S&P 500 gained 1.5%. The Asian market was following a similar pathway but in smaller steps as Hang Seng advanced 0.06%, and ASX moved 0.34%.
Hang Seng
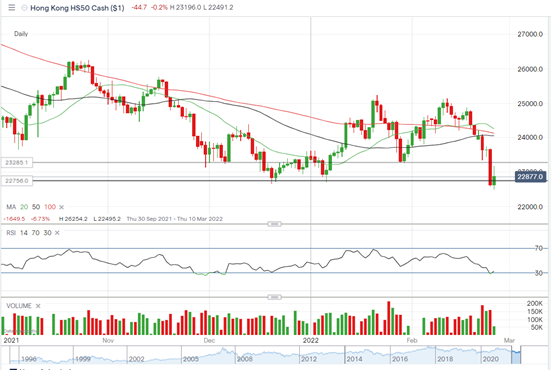
A long red candlestick from Thursday has sent the index to its lowest level of the year at 22587. Even though the rebound on Friday has left a long leg up, the index is still struggling to secure the current support level around 22756. The RSI reading, which just made a U-turn from the oversold territory may explain the rebound on Friday's early trading session.
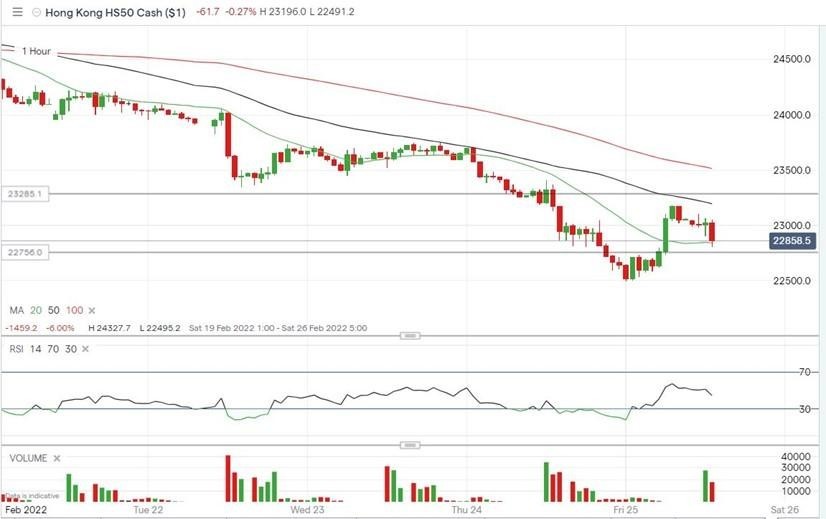
The hourly chat shows the 50-MA is acting as the current resistance from a short-term perspective, while major pressure will be released from the level of 23285 (as shown from the daily chart).
Looking ahead, the long-term downtrend for the Hang Seng index remains at play, given a deluge of adverse catalysts for the stock market. Apart from the geopolitical crisis far away from the island, the local pandemic, the renewed restriction, and the economy’s slowing down in its motherland, China could deteriorate investors’ appetite for equity.
Hang Seng Daily Chart
 Source: IG
Hang Seng Hourly Chart
 Source: IG
ASX
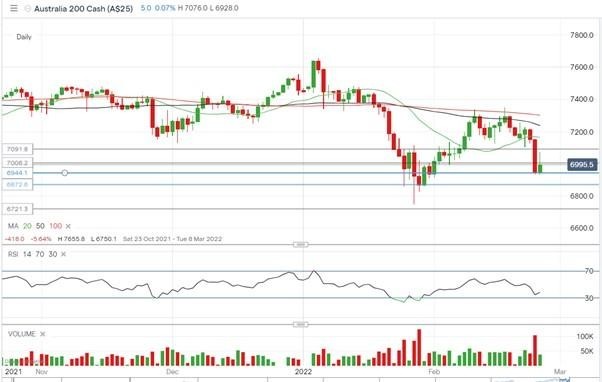
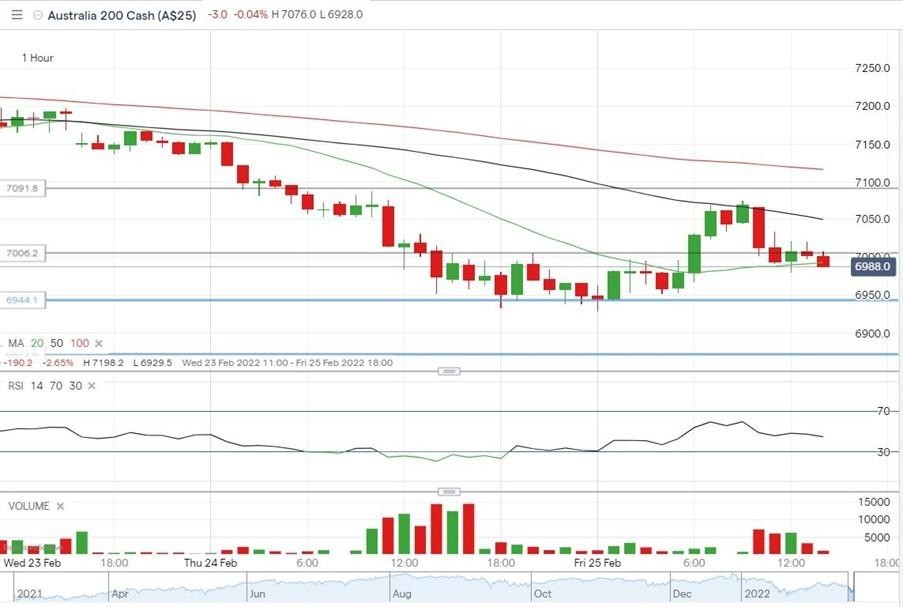
The Australian stock market made its greatest loss in 18 months (-2.8%) on Thursday. A mild gain on Friday has prevented the index from dipping to its lowest level of the year and is currently supported at 6944.
The hourly chart suggests the level of 7050 could be the ceiling for the rebound in the near term even though the daily RSI reading is pointing to the north. Next support for the ASX can be found from the January low at 6872 and further down to that level, the index will erase all gains since March 2021.
ASX Daily Chart
 Source: IG
ASX Hourly chart
 Source: IG
Take your position on over 13,000 local and international shares via CFDs or share trading – and trade it all seamlessly from the one account. Learn more about share CFDs or shares trading with us, or open an account to get started today.


0 Comments
Recommended Comments
There are no comments to display.
Create an account or sign in to comment
You need to be a member in order to leave a comment
Create an account
Sign up for a new account in our community. It's easy!
Register a new accountSign in
Already have an account? Sign in here.
Sign In Now