Trading the London Session: Guide for Forex Traders

Entry posted by MongiIG in Analyst Piece
1,964 views

- Reviewed by Nick Cawleu, July 26, 2022
The London trading session accounts for around 35% of total average forex turnover*, the largest amount relative to its peers. The London forex session also overlaps with the New York session throughout the year.
Key talking points in this article:
- What time does the London forex market open?
- Top three things to know about the London trading session
- What currency pairs are the best to trade?
- How to trade breakouts during the London session.
WHAT TIME DOES THE LONDON FOREX MARKET OPEN?
The London forex market hours are from 3:00 AM ET to 12:00 PM ET. The London forex market session sees the most forex volume of all the forex market sessions.
Time in ET.
| OPEN | 3:00 AM |
|---|---|
| Close | 12:00 PM |
| Overlap with Asia session | 3:00 AM – 4:00 AM |
| Overlap with New York session | 8:00 AM – 12:00 PM |
TOP 3 THINGS TO KNOW ABOUT THE LONDON TRADING SESSION
1. The London session is fast and active
The slower Tokyo market will lead into the London session, and as prices begin to move from liquidity providers based in the United Kingdom, traders can usually see increases in volatility.
As prices begin to come in from London, the ‘average hourly move’ on many of the major currency pairs will often increase. Below is analysis on EUR/USD based on the time of day. Notice how much greater these moves are, on average, after the Asian session closes (Asia session closes at 3AM ET-blue dot):
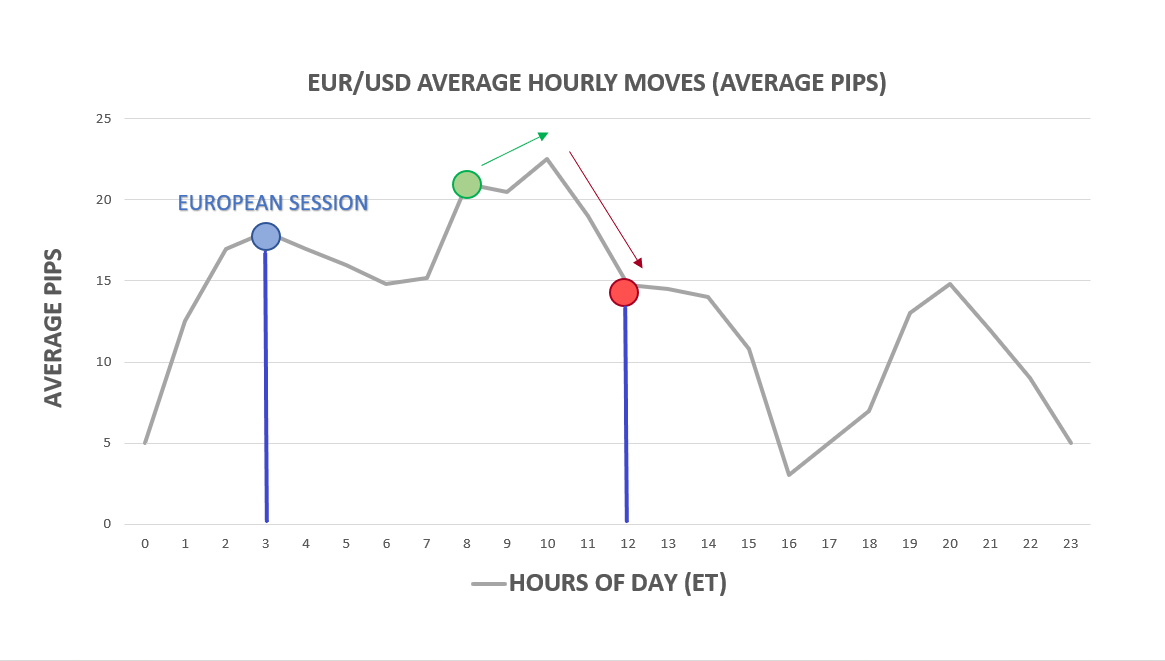
Support and resistance may be broken much more easily than it would during the Asian session (when volatility is usually lower).
These concepts are central to the trader’s approach when speculating in the London Session, as traders can look to use this volatility to their advantage by trading breakouts. When trading breakouts, traders are looking for volatile moves that may continue for an extended period of time.
2. Look out for the overlap
The ‘overlap’ is when the London and US sessions literally overlap each other (8AM ET to 12PM ET). These are the two largest market centers in the world, and during this four-hour period large and fast moves can be seen during the overlap as a large amount of liquidity enters the market.
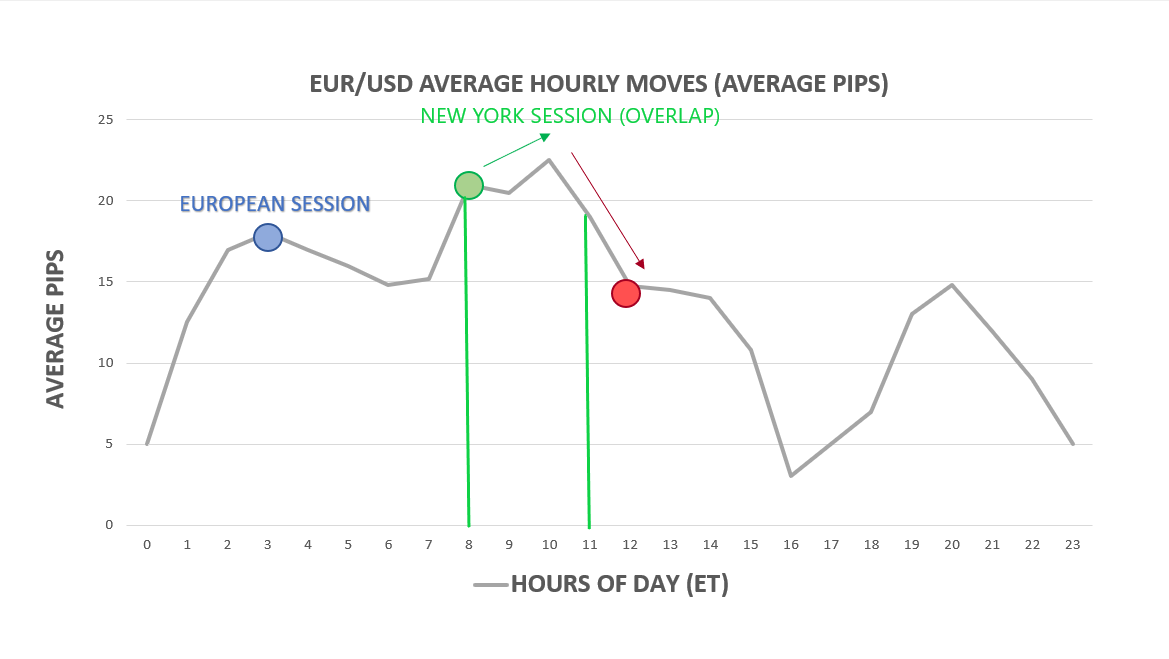
As seen in the image above, the volatility increases to a maximum from 8:00 AM to 12:00 PM ET - when the London forex session overlaps with the New York forex session. To trade the overlap, traders can use a break-out strategy which takes advantage of the increased volatility seen during the overlap.
3. High liquidity
The London forex session is one of the most liquid trading sessions. Due to the high volume of buying and selling, major currency pairs can trade at extremely low spreads. Day traders looking to target short moves may be interested in finding trends and breakouts to trade so as to reduce the cost they pay in spread s.
WHAT CURRENCY PAIRS ARE THE BEST TO TRADE DURING THE LONDON SESSION?
There are no ‘best’ currency pairs to trade during London forex market hours, but there are currency pairs that will reduce in spread due to the high volume and allow traders cheaper spread costs.
These currencies include the major currency pairs like EUR/USD, USD/JPY, GBP/USD, and USD/CHF. The major currency pairs trade in extremely high volumes during the London forex session.
Currency pairs that are most affected by the overlap include the EUR/USD, USD/JPY, GBP/USD due to the inter-bank activities between the United States and Europe/London. If your trading strategy is better suited for volatility, then these are the trading pairs to watch because they will be flooded with liquidity and will move more on average during the overlap.
HOW TO TRADE BREAKOUTS DURING THE LONDON SESSION
Trading breakouts during the London session using a London breakout strategy is much the same as trading breakouts during any other time of day, with the addition of the fact that traders may expect an onslaught of liquidity and volatility at the open.
When traders look to trade breakouts, they are often seeking firm support or resistance to plot their trades.
The chart below illustrates a rising wedge pattern, a trend line with a resistance level that is eventually broken- a breakout.
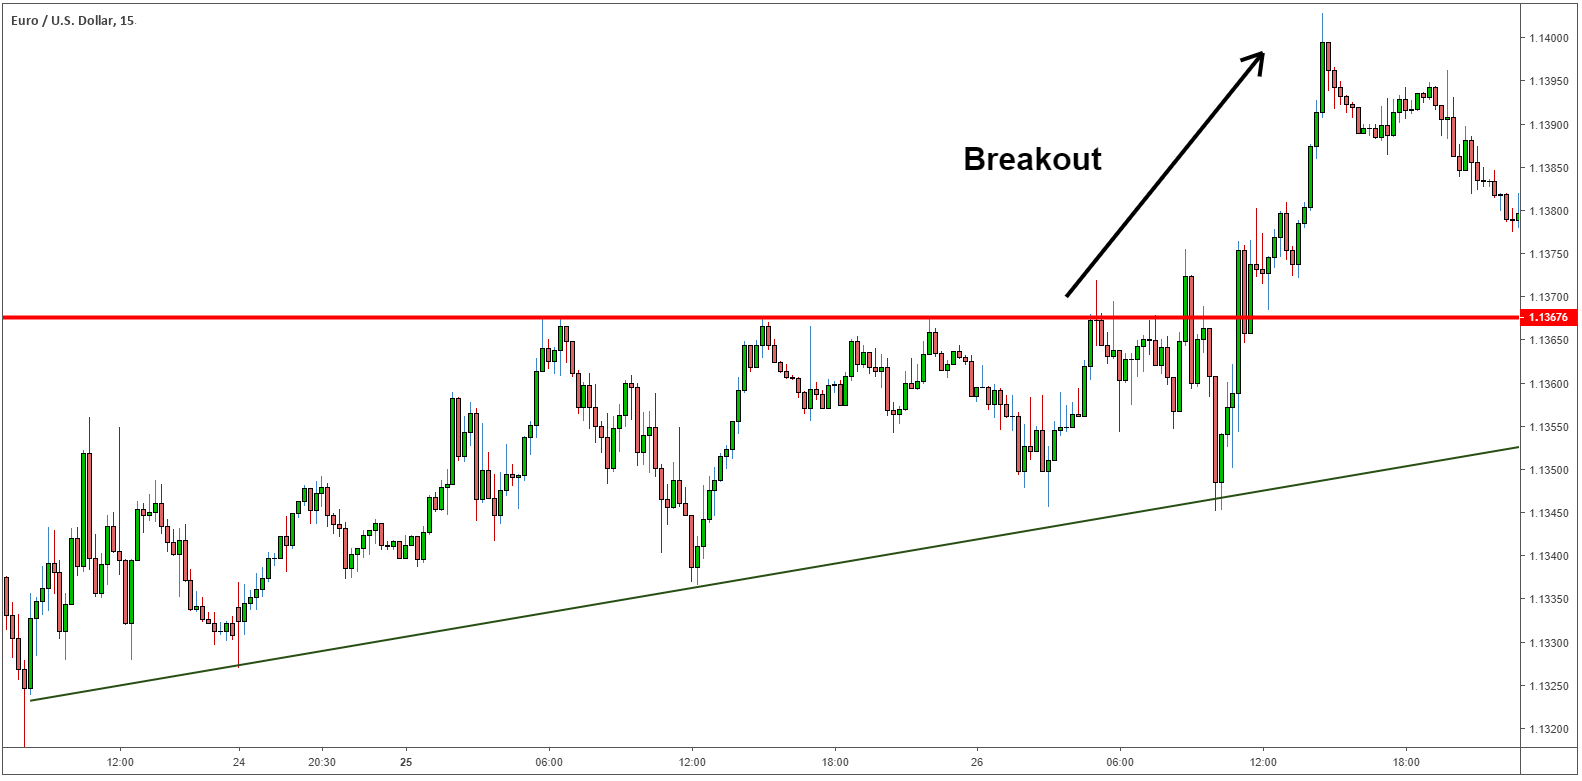
The big benefit of this setup is risk management. Traders can keep stops relatively tight, with their stop-losses trailing close to the trend line. If the support/trend line does break, losses are limited, and if the strategy does prevail it could lead to a positive risk-reward ratio.
The increase in liquidity during the London session coupled with the increase in volatility makes potential breakouts much more likely.
LONDON SESSION TRADING STRATEGIES AND TIPS
Remember, when trading the London open volatility and liquidity rises, so be wary and utilize the appropriate leverage when trading. If you’re new to forex trading, download our Forex for beginners trading guide to get to grips with the basics.
Like the London forex trading session, the New York session and Asian forex session also have unique characteristics that forex traders should be aware of.
Key tips:
- Liquidity and volatility increase during the London session.
- Breakouts could occur more frequently during the London session.
- Remember to watch for the overlap between the London session and the New York session for increased volatility and liquidity.
Bank of International Settlements (BIS) Triennial Report from 2016*
Nov 3, 2022 | David Bradfield, Markets Writer. DailyFX
-
 1
1


.jpeg.98f0cfe51803b4af23bc6b06b29ba6ff.jpeg)

0 Comments
Recommended Comments
There are no comments to display.
Create an account or sign in to comment
You need to be a member in order to leave a comment
Create an account
Sign up for a new account in our community. It's easy!
Register a new accountSign in
Already have an account? Sign in here.
Sign In Now