AUD soared as RBA released minutes; and Nasdaq jumped at the brighter economic outlook

Entry posted by ArvinIG in Analyst article
701 views
Today, we look at where the four markets are heading: AUD/USD, Nasdaq, Brent Crude Oil and Bitcoin

Source: Bloomberg
Risk sentiment returned to the market this week and eased growing concern after the release of strong US retail and industrial data. In Australia, the RBA’s May meeting minutes put the possibility of a 40bps hike on the table for June and China’s plan to ease Shanghai out of its lockdown has supported energy prices in recent sessions.
AUD/USD
The concern for a US recession triggered by hotter than expected CPI data last week managed to push the AUD/USD to its lowest point since June 2020. Moreover, the demand for the Aussie dollar has been hit as iron ore prices tumbled, weighing heavily on the AUD as a commodity currency.
This week the Australian currency was lifted as the RBA’s minutes increased the probability of a 40bps rate rise. The Australian dollar rose to 70.15 and delivered its third consecutive day of gains but was still more than 5% lower than a month ago.
From a technical standpoint, the rise on Tuesday has helped the AUD/USD break through April's descending trend line while bringing the 20-day moving average around 0.705 into view. Current support sits at 0.6932.
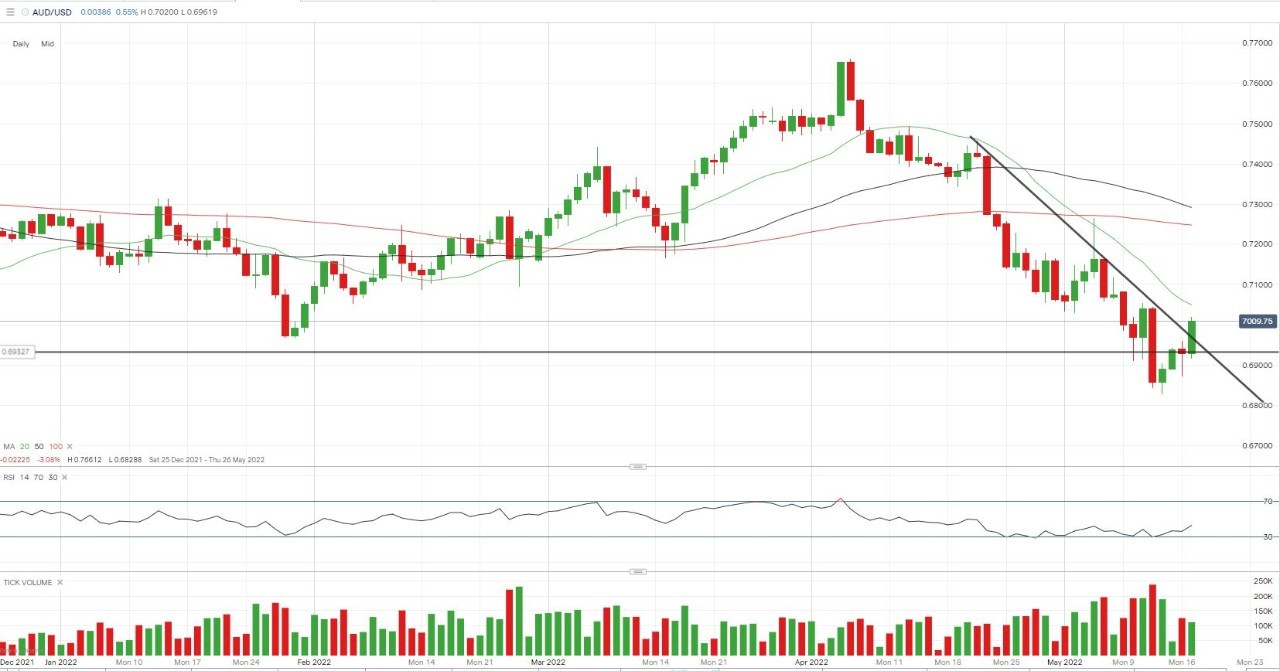
Source: IG
Nasdaq
U.S. stocks rebounded on Tuesday thanks to retail sales rising 0.9% last month, following a 1.4% surge in March. The data helped ease growing concern about the economic outlook which has lately fuelled pessimistic sentiment. Meanwhile, Federal Reserve chairman Jerome Powell reiterated in a public speech that he will 'keep pushing' to tighten the U.S. monetary policy until it is clear that inflation is in decline.
Nasdaq led the advance on Wall Street by soaring 2.62%. Technically, the bounce has broken through the April trendline and brought the 20-day MA at around 12722 as a possibility. Looking forward, the line connected by previous lows can be viewed as a key support for the Nasdaq while the March low (12944) should be a key challenge in the near future.
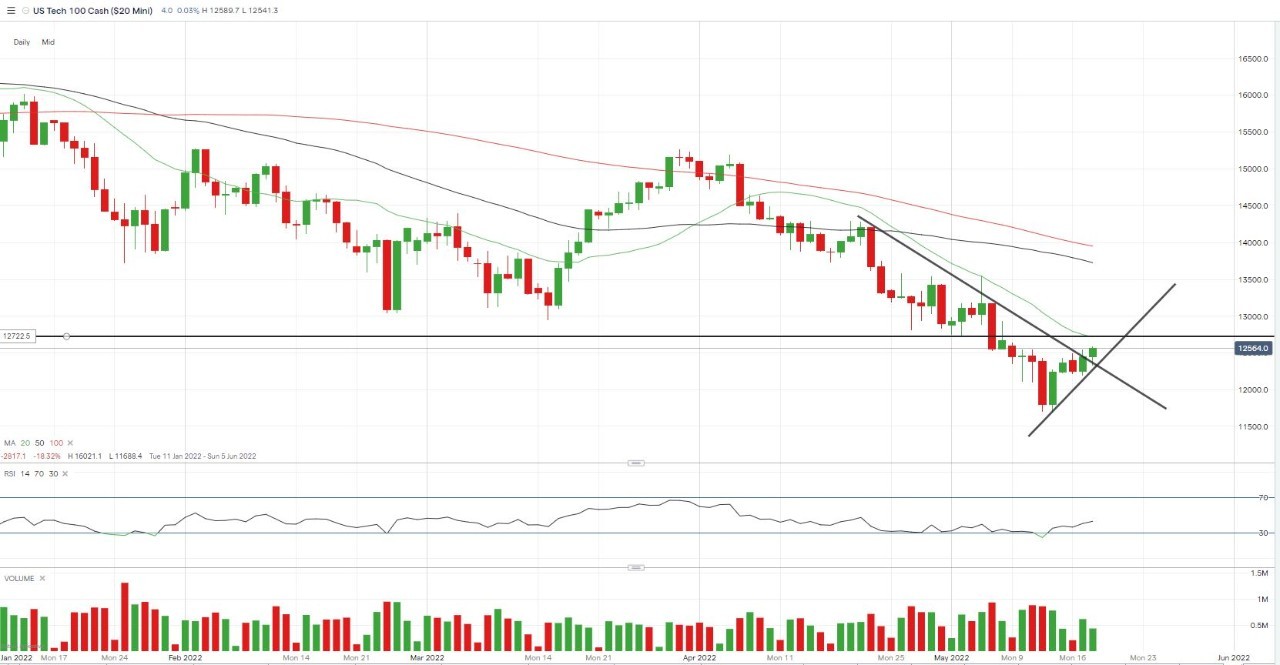
Source: IG
Brent Crude oil
The concern about supply and demand has pushed up oil prices in recent sessions.
The ongoing conflict in Ukraine shows no signs of easing and with the expectations of further bans on Russian energy by the EU and US decisively means that a lack of supply will be a long-term norm for crucial energy.
On the demand side, China recently announced it would bring normality back to 25 million Shanghai residents by mid-June. This wouold offset previous concern for a shrinking demand in oil even if the risk of a future lockdown can’t be ruled out. Brent Crude rallied sharply in the second half of last week and edged above the $110 level. The daily chart shows that the price is now sitting above the 20, 50, and 100 MA, suggesting a bull-biased sentiment is taking the lead.
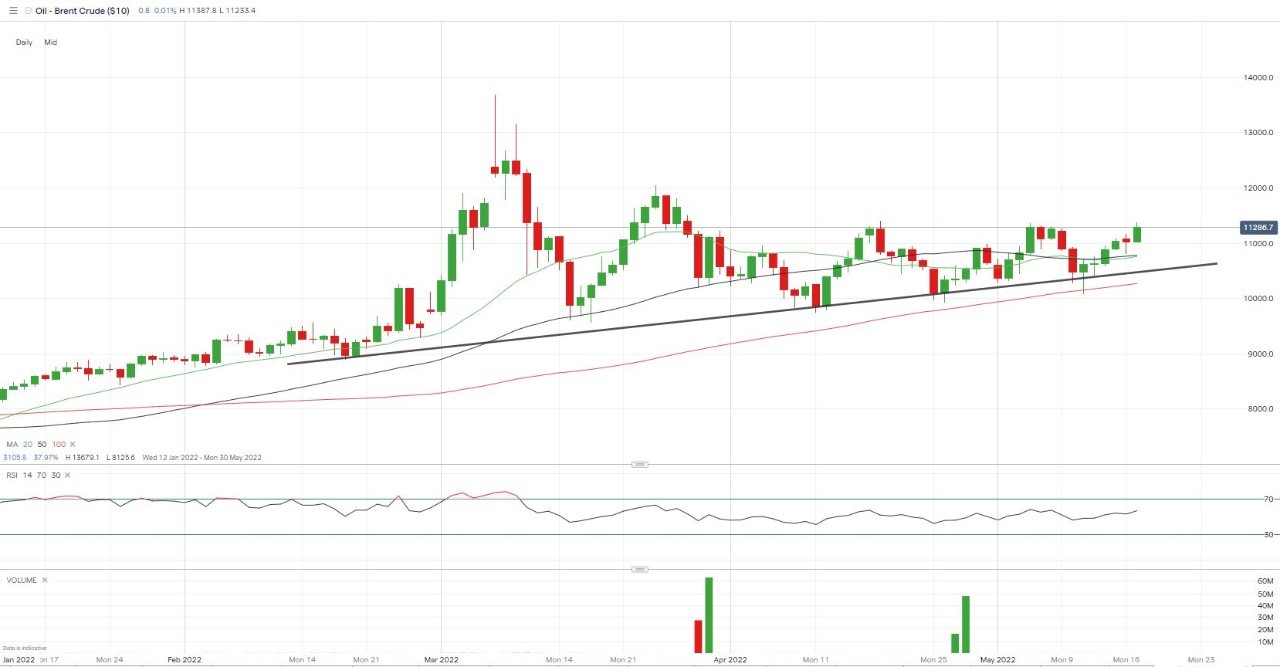
Source: IG
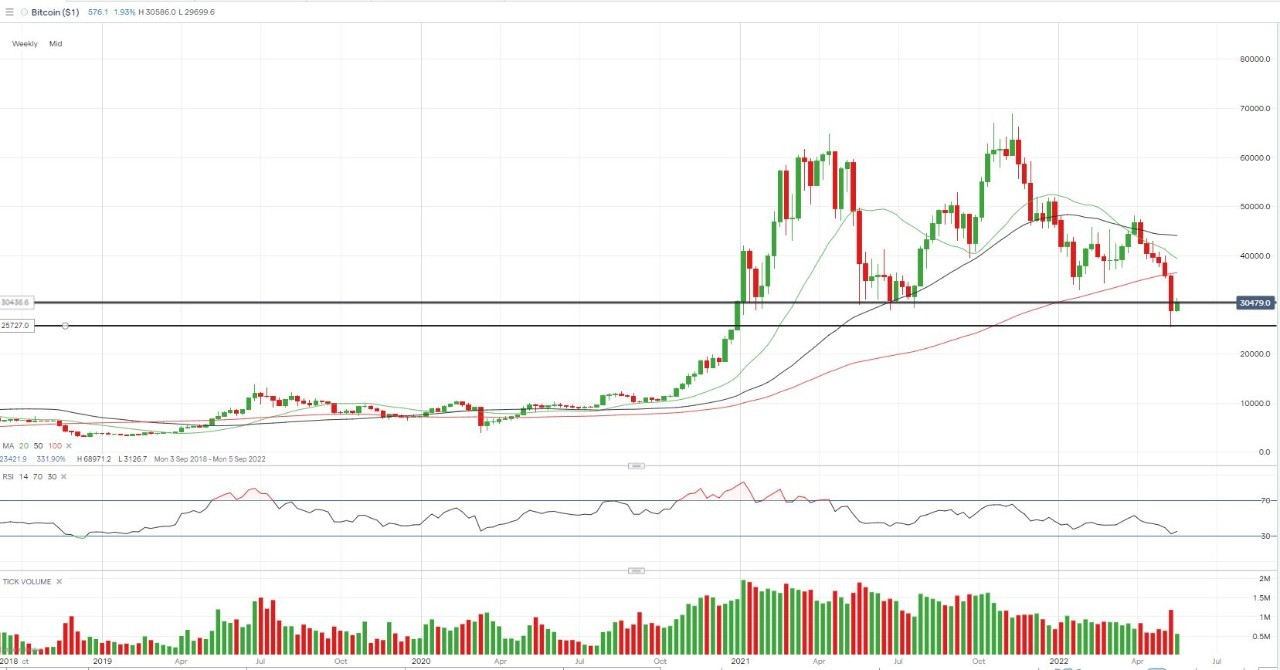
Bitcoin
Cryptocurrency has shown signs of stabilizing after a bloodbath last week wiped $200 billion from the market, with the prices of Bitcoin and Ethereum plunging to their lowest level in more than 12 months.
The selling pressure for Bitcoin has shown some signs of easing this week following optimism resurfacing in the stock market. The short-term bullish idea has pushed the price up from its 18-month low level recorded last week at $25385 and is now back at 30k.
The four-hour chart shows a clear uptrend for the price to bottom out from the recent low while encountering resistance near 30436. However, the long-term chart (weekly) suggests the price is staying way behind its short, mid and long-term moving averages. In other words, the bear-biased sentiment remains intact.
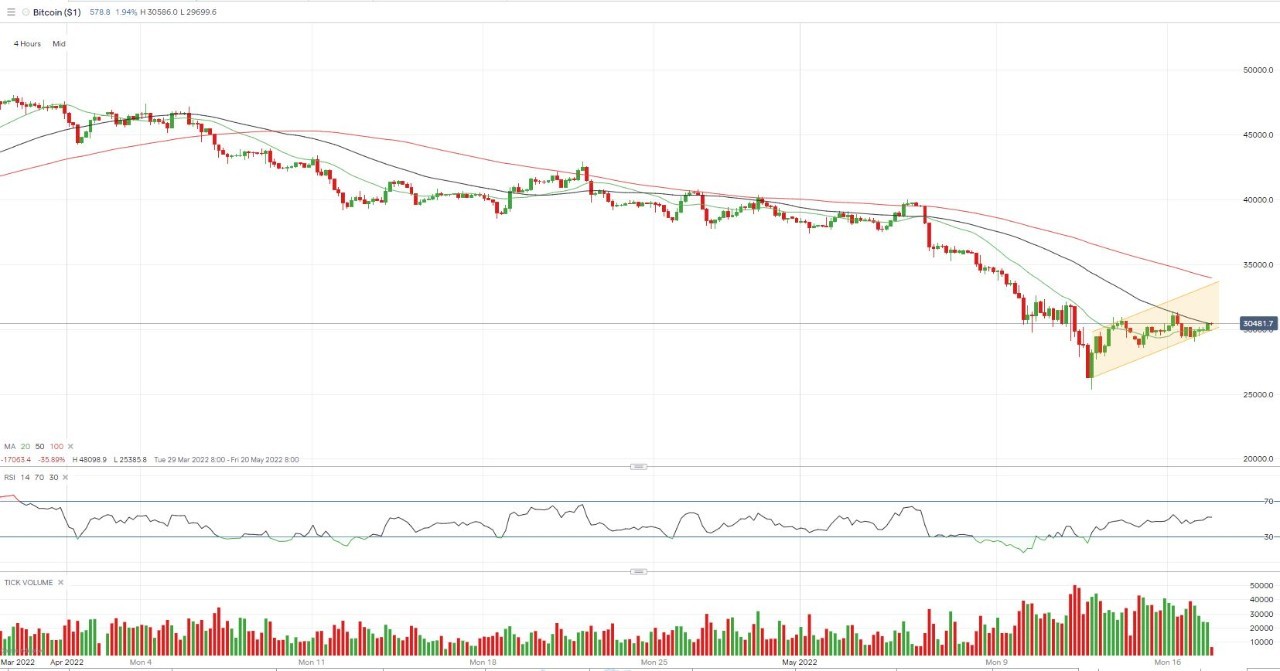
Source: IG
Source: IG
Take your position on over 13,000 local and international shares via CFDs or share trading – and trade it all seamlessly from the one account. Learn more about share CFDs or shares trading with us, or open an account to get started today.
Hebe Chen | Market Analyst, Melbourne
18 May 2022


0 Comments
Recommended Comments
There are no comments to display.
Create an account or sign in to comment
You need to be a member in order to leave a comment
Create an account
Sign up for a new account in our community. It's easy!
Register a new accountSign in
Already have an account? Sign in here.
Sign In Now