Have Alibaba shares resumed their bear trend?

Entry posted by MongiIG in Market News
942 views
Alibaba’s share price resumed its descent following quashed rumours of an Ant Group IPO amid a general tech rout.
 Source: Bloomberg
Have Alibaba shares resumed their descent?
The recent near 50% rally in the Alibaba share price (BABA), on the back of China approving new video games in a further sign Beijing is easing its tech crackdown and a Bloomberg report of early stage discussions on reviving the initial public offering (IPO) of Jack Ma’s Ant Group, seems to have ended at last week’s share price high.
Last Tuesday China's National Press and Publication Administration (NPAA) approved 60 online games, the largest approval of titles for the country's $45 billion online entertainment industry since mid-2021, according to the South China Morning Post.
Alibaba shares rallied alongside other US-listed Chinese tech stocks following the announcement, with the approval of a new batch of video games in China raising hopes that Beijing remains on track to further relax its crackdown on its technology sector.
Alibaba Group Holdings' US-listed shares rallied further in pre-market trading on Thursday on a Bloomberg News report on preliminary talks of an initial public offering of Ant Group but then rapidly slipped and erased all of its previous intraday gains after China’s regulator denied these claims.
Since then, the IG Daily Financial Bet (DFB) of the Alibaba share price dropped by nearly 20% from last week’s $127.96 high amid general risk-off sentiment and a global rout in technology stocks as Friday’s stronger than expected US inflation reading for May came in at 8.6% year-on-year, the highest since December 1981, prompting investors to sell their shares.
With investors worrying about the US Federal Reserve (Fed) having to hike interest rates more aggressively than previously anticipated, perhaps by as much as 75 basis points (BPS) at Wednesday’s Federal Open Market Committee Meeting (FOMC) and factoring in 255bps of tightening in its five remaining meetings this year, equity markets and especially technology shares have been in free-fall these past few days.
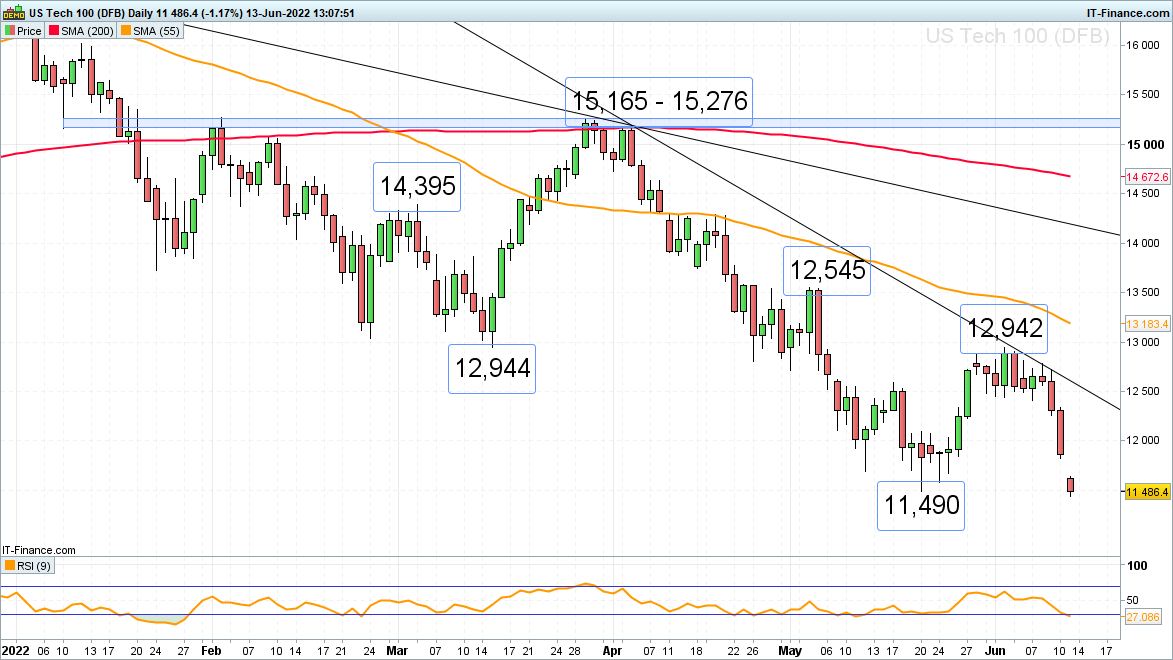
The Nasdaq 100 is thus trading back in bear market territory and close to its May low, a drop through which on a daily chart closing basis, would most likely lead to the significant 11,072 to 10,677 support area being eyed. It encompasses the July 2020 high, September and November 2020 lows as well as the 200-week simple moving average (SMA).
 Source: ProRealTime
Are there fundamental reasons to buy Alibaba shares?
According to The Motley Fool, Alibaba's revenue rose by 19% to 853.1 billion yuan ($134.6 billion) in its fiscal year to 2022, which ended at the end of March. Its Chinese commerce revenue rose 18%, and its cloud revenue increased by 23%.
Alibaba generates all of its operating profits from its online and offline retail businesses but is still subsidising the expansion of its cloud segment, Alibaba Cloud, the largest in China, which continues to rack up operating losses and can only produce a thin profit on an adjusted earnings before interest, taxes, and amortisation (EBITA) basis.
Alibaba still generates most of its revenue in China, but it's been under close scrutiny of the country's antitrust regulators and was fined a record $2.8 billion last year, then forced to end its exclusive deals with top merchants and rein in its promotional deals.
Added to the behemoth’s woes, the US Securities and Exchange Commission (SEC) has threatened to delist Alibaba and other Chinese stocks from US stock markets as early as next year if they don't comply with US auditing standards. That unresolved threat should make investors think twice before buying Alibaba shares as a long-term investment.
Nibble traders can hugely benefit from the Alibaba share price volatility, though. After all which other shares offer 30-50% gains, both by buying or selling the stock, within a matter of weeks?
What does the technical picture look like?
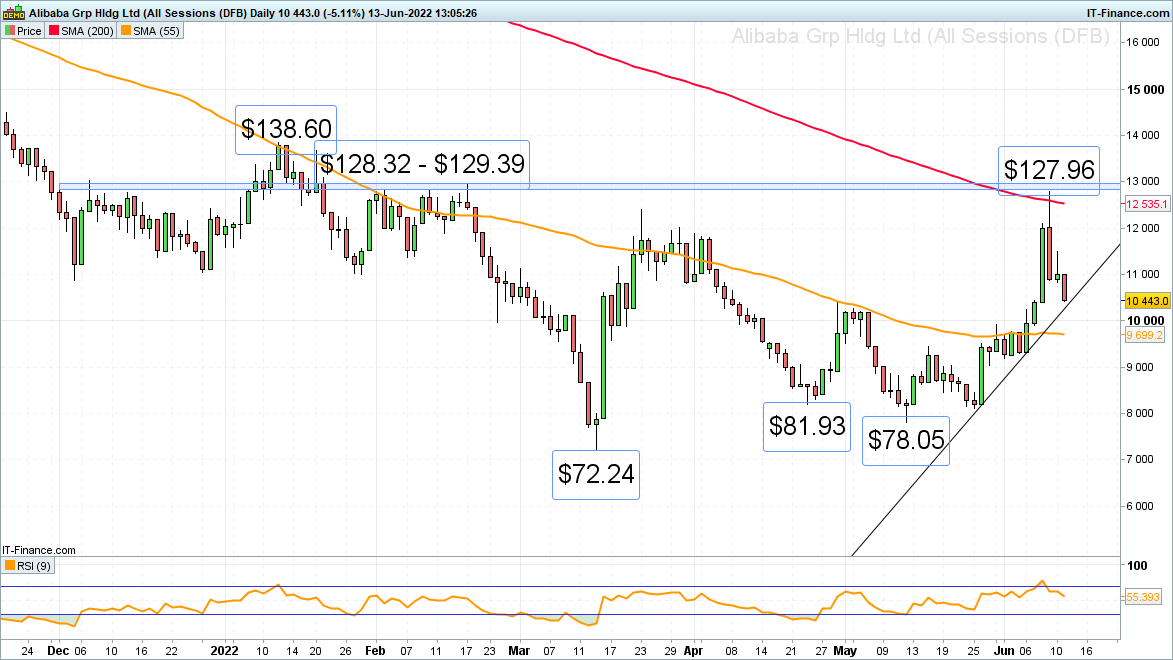
Last week’s failure close to the 200-day SMA at $125.35 and just below the $128.32 to $129.39 resistance area, consisting of the December and February highs, doesn’t bode well for the bulls.
 Source: ProRealTime
The one-month uptrend line at $102.80 may offer short-term support today but if slid through on a daily chart closing basis later in the week, the 55-day SMA at $96.99 and also the early June low at $91.89 will be in the limelight. A drop below $91.89 could trigger a sell-off all the way back to the March-to-May lows at $81.93 to $72.24.
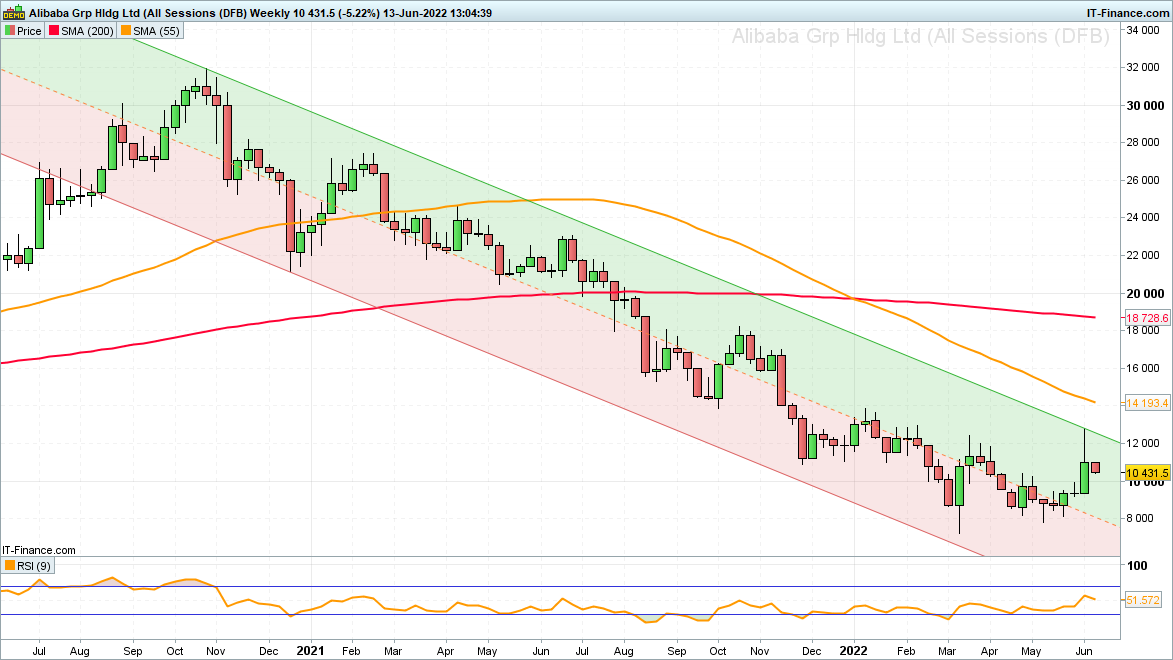
Minor resistance can be spotted at Friday’s high at $115.01 with further resistance being seen around the minor psychological $120 mark, where the late March and early April highs were made. It should be noted, however, that despite Alibaba’s last few weeks’ rally, its share price remains in a clearly defined downtrend channel on the weekly chart and has been in a bear trend since last October.
 Source: ProRealTime


0 Comments
Recommended Comments
There are no comments to display.
Create an account or sign in to comment
You need to be a member in order to leave a comment
Create an account
Sign up for a new account in our community. It's easy!
Register a new accountSign in
Already have an account? Sign in here.
Sign In Now