EUR/USD rate approaches yearly low with Fed rate hike on tap

Entry posted by ArvinIG in Analyst article
673 views
EUR/USD trades to a fresh monthly low as it extends the series of lower highs and lows from last week and the exchange rate appears to be on track to test the yearly low as the Fed is expected to implement higher interest rates.

Source: Bloomberg
EUR/USD rate approaches yearly low with Fed rate hike on tap
EUR/USD has depreciated approximately 3% from the start of the month as US Treasury yields climb to a fresh yearly high, and the Federal Open Market Committee (FOMC) rate decision may keep the exchange rate under pressure as the central bank is anticipated to deliver another 50bp rate hike.
Source: DailyFX
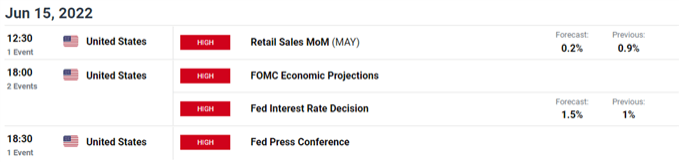
With that in mind, the update to the US Retail Sales report may generate a limited reaction as the Fed is slated to update the Summary of Economic Projections (SEP), and a shift in the forward guidance for monetary policy is likely to influence foreign exchange markets as the central bank warns that “a restrictive stance of policy may well become appropriate depending on the evolving economic outlook.”
As a result, the US dollar may continue to outperform against its European counterpart if Chairman Jerome Powell and Co. continue to raise their longer-run forecast for the Fed Funds rate, but EUR/USD may attempt to defend the yearly low (1.0349) should the central bank retain the current course for monetary policy.
In turn, more of the same from the FOMC may generate a mixed reaction in EUR/USD as the European Central Bank (ECB) shows a greater willingness to shift gears in 2022, but the tilt in retail sentiment looks poised to persist as traders have been net-long the pair for most of the year.
Source: DailyFX
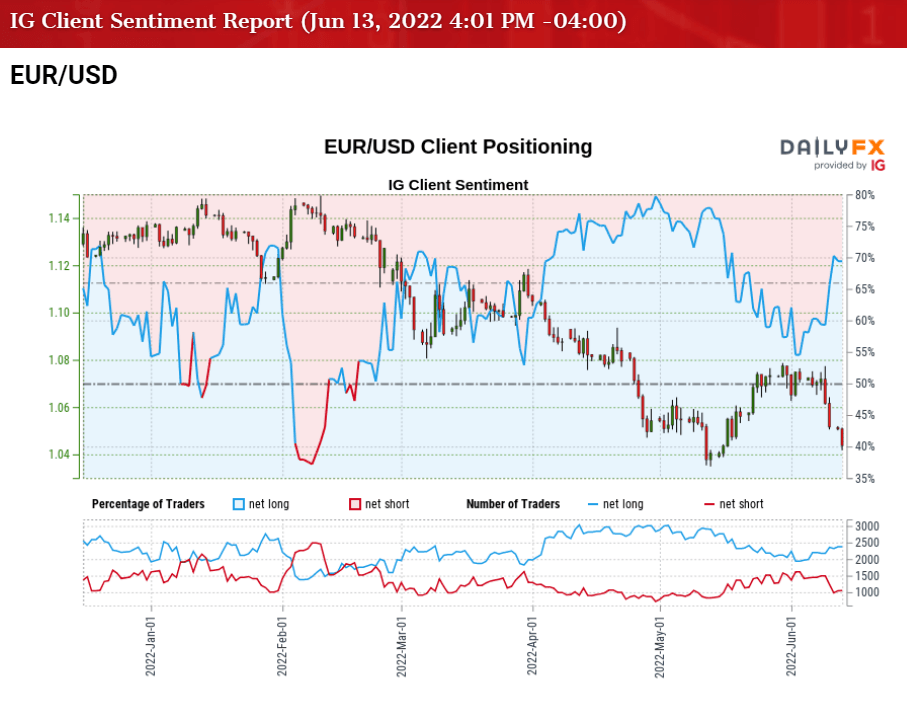
The IG Client Sentiment report shows 68.58% of traders are currently net-long EUR/USD, with the ratio of traders long to short standing at 2.18 to 1.
The number of traders net-long is 1.81% higher than yesterday and 12.16% higher from last week, while the number of traders net-short is 3.46% higher than yesterday and 26.05% lower from last week. The rise in net-long interest has fueled the crowding behavior as 57.33% of traders were net-long EUR/USD at the start of the month, while the decline in net-short position comes as the exchange rate trades to a fresh monthly low (1.0400).
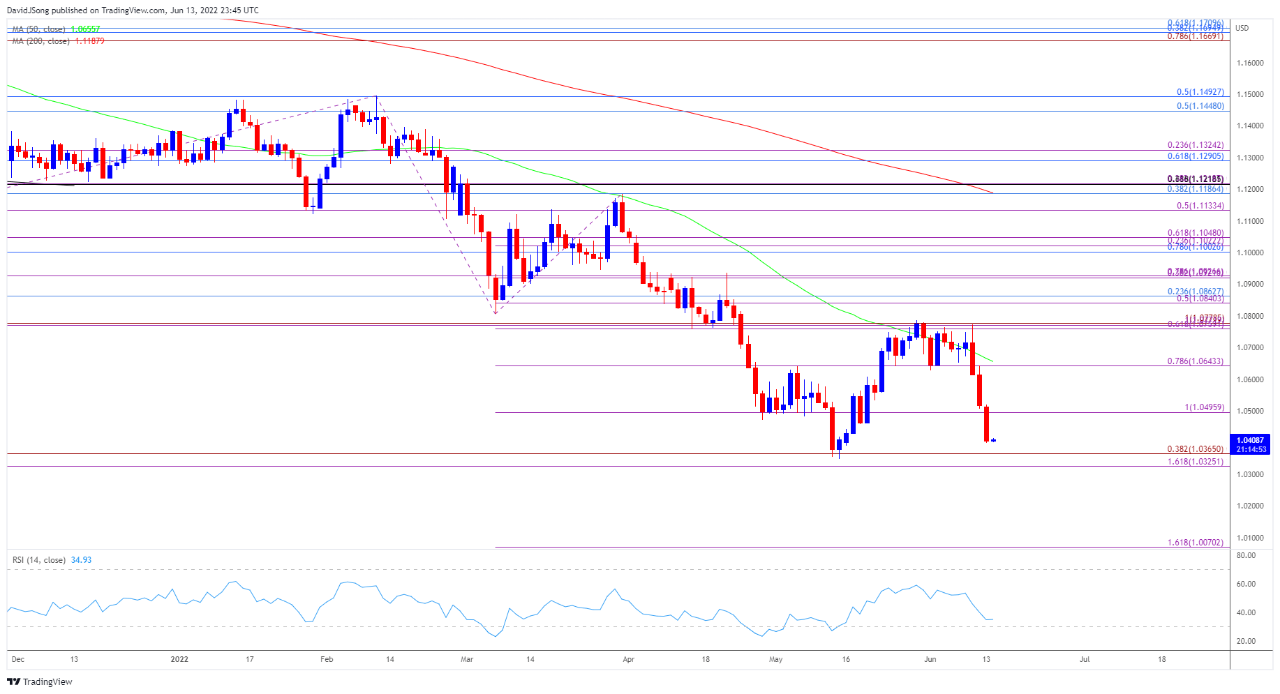
With that said, EUR/USD may continue to carve a series of lower highs and lows over the coming days as the Fed is expected to implement higher interest rates, and a move below 30 in the Relative Strength Index (RSI) is likely to be accompanied by a further decline in the exchange rate like the price action seen earlier this year.
Source: TradingView
David Song | Analyst, DailyFX, New York City
14 June 2022
This information has been prepared by DailyFX, the partner site of IG offering leading forex news and analysis. In addition to the disclaimer below, the material on this page does not contain a record of our trading prices, or an offer of, or solicitation for, a transaction in any financial instrument. IG accepts no responsibility for any use that may be made of these comments and for any consequences that result. No representation or warranty is given as to the accuracy or completeness of this information. Consequently any person acting on it does so entirely at their own risk. Any research provided does not have regard to the specific investment objectives, financial situation and needs of any specific person who may receive it. It has not been prepared in accordance with legal requirements designed to promote the independence of investment research and as such is considered to be a marketing communication. Although we are not specifically constrained from dealing ahead of our recommendations we do not seek to take advantage of them before they are provided to our clients.


0 Comments
Recommended Comments
There are no comments to display.
Create an account or sign in to comment
You need to be a member in order to leave a comment
Create an account
Sign up for a new account in our community. It's easy!
Register a new accountSign in
Already have an account? Sign in here.
Sign In Now