Markets week Ahead: Dow Jones, US Dollar, USD/CAD, GBP/USD, USD/JPY, Powell, Inflation

Entry posted by ArvinIG in Analyst article
433 views
Source: Bloomberg
Global financial markets moved diligently to price in the latest action from the Federal Reserve last week when Mr. Powell’s FOMC raised the US benchmark rate by 75-basis-points. The jumbo rate hike tempered inflation expectations, and perhaps returned some credibility to the institution. However, the impact on equity markets was undeniably bearish. The Dow Jones Industrial Average (DJIA) fell over 4% to its lowest level since November 2020.
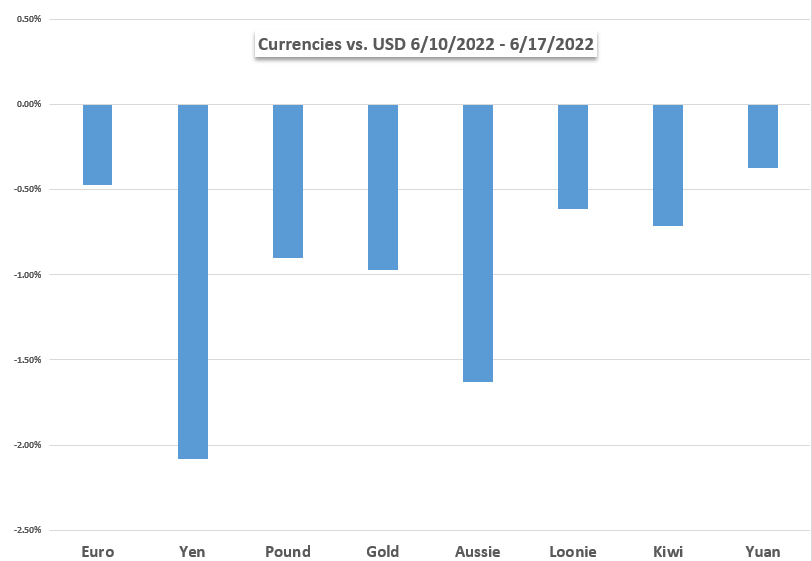
The US dollar benefited from the safe-haven flows despite an immediate reaction to the downside. The DXY index was up around 0.50% going into the weekend. However, there are technical signs across major crosses, such as EUR/USD, GBP/USD, AUD/USD and USD/CAD, that show the dollar’s ascent is perhaps at or near a critical juncture. The Bank of England remained in a relatively dovish stance, hiking its benchmark rate by 0.25%. The dollar advanced against the pound, but trimmed some of those gains in the second halve of the week.
Oil prices plummeted on Friday as traders baked in growing fears over a Fed-induced recession. That comes amid the summer driving season, which typically sees higher demand for fuels persist into the fall months. Natural gas prices found relief in the United States after an LNG terminal suffered a catastrophic failure, likely to take months to repair. European prices, however, skyrocketed. The development is likely to keep prices in Europe elevated, further complicating Europe’s inflation outlook.
Speaking of energy prices, Canada is set to report inflation data for May on Wednesday. The country’s consumer price index (CPI) is expected to cross the wires at 7.5% on a year-over-year basis. That would be up from April’s 6.8% y/y increase. A hotter-than-expected print would likely inspire already-aggressive Bank of Canada rate hike bets, potentially bolster the CAD.
Japan is also slated to release inflation data for May. The Bank of Japan held firm in its dovish stance last week against a market that appeared to be trying to force the BoJ’s policy stance. That didn’t happen. The mantra of 'don’t fight the Fed' seems to be just as appropriate for the Bank of Japan. The yen fell versus the dollar last week, although the pace of losses started to cool. A hotter-than-expected CPI print out of Japan may actually see USD/JPY fall.
This information has been prepared by DailyFX, the partner site of IG offering leading forex news and analysis. In addition to the disclaimer below, the material on this page does not contain a record of our trading prices, or an offer of, or solicitation for, a transaction in any financial instrument. IG accepts no responsibility for any use that may be made of these comments and for any consequences that result. No representation or warranty is given as to the accuracy or completeness of this information. Consequently any person acting on it does so entirely at their own risk. Any research provided does not have regard to the specific investment objectives, financial situation and needs of any specific person who may receive it. It has not been prepared in accordance with legal requirements designed to promote the independence of investment research and as such is considered to be a marketing communication. Although we are not specifically constrained from dealing ahead of our recommendations we do not seek to take advantage of them before they are provided to our clients.


0 Comments
Recommended Comments
There are no comments to display.
Create an account or sign in to comment
You need to be a member in order to leave a comment
Create an account
Sign up for a new account in our community. It's easy!
Register a new accountSign in
Already have an account? Sign in here.
Sign In Now