Major US indices inched higher post-Fed minutes: S&P 500, China A50, GBP/USD

Entry posted by MongiIG in Market News
942 views
Major US indices inched higher overnight, even as the release of the Fed minutes pointed towards the possibility of ‘even more restrictive’ monetary policy should inflation persists.
 Source: Bloomberg
Market Recap
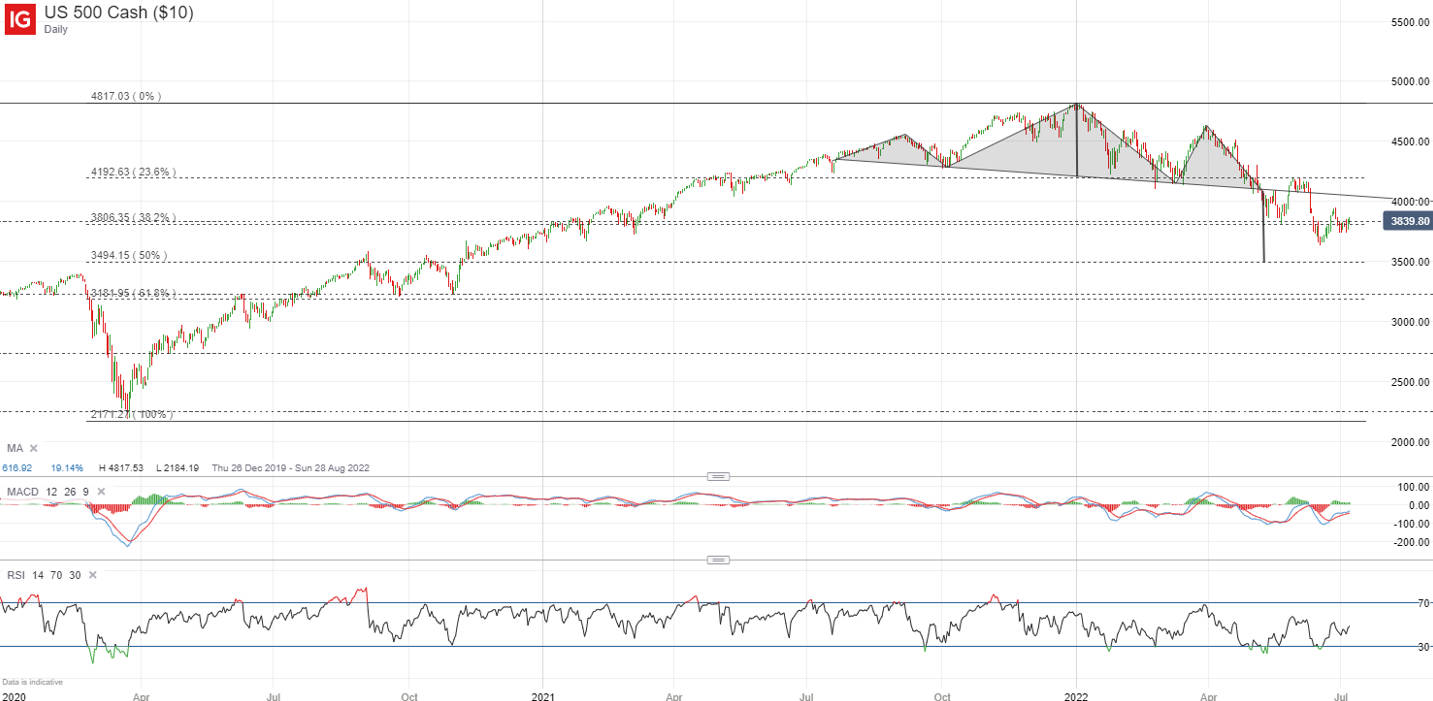
Major US indices inched higher overnight (DJIA +0.23%; S&P 500 +0.36%; Nasdaq +0.35%), even as the release of the Fed minutes pointed towards the possibility of ‘even more restrictive’ monetary policy should inflation persists. The resolve from the Fed to tame inflation could have already been recognised by the markets over many months under the central bank’s guidance, and the tick lower in breakeven inflation indicators suggests that markets are increasingly convinced. Rate hike bets as seen from the Fed Funds futures were revised upwards after the minutes release, with market participants leaning further towards a 75 basis-point (bp) increase in the July’s Federal Open Market Committee (FOMC) meeting, along with a broad-based jump in Treasury yields.
Market focus may have revolved around any hints pertaining to the economic outlook. The release of the Fed minutes came with the avoidance of any outright mention of ‘recession’, while providing guidance that the ‘real gross domestic product (GDP) growth was expanding in the current quarter, with consumption spending remaining strong’. That may have been a catalyst for relief, along with economic data overnight painting a more optimistic economic picture on a stronger-than-expected Institute for Supply Management (ISM) services purchasing managers' index (PMI) data for June (55.3 versus 54.3 forecast) and a higher-than-expected May’s job opening figure (11.25mn versus 11mn forecast). Recovery in some economically-sensitive sectors were seen as a result.
However, recession concerns are far from over, with oil prices delivering another 4% drop overnight. Bond yields could risk forming another lower high, while the employment sub-index in the US services PMI has dropped into contractionary territory. While the S&P 500 may continue to push higher in the near-term, further up-move in the index could face a key test of resistance at the 4,000 level.
 Source: IG charts
Asia Open
Asian stocks look set for a slightly positive open, with Nikkei +0.36%, ASX +0.42% and KOSPI +1.05% at the time of writing. Despite the positive performance in Wall Street overnight, the Nasdaq Golden China Index closed more than 4.6% lower, following through with the negative performance in Chinese equities yesterday on increasing virus cases. While the swift and aggressive measures being undertaken to contain spreads may avoid the scale of outbreak back in April this year, the uncertainty of the need for further economic restrictions are driving some unwinding of previous bullish bets, leading to some near-term caution around Chinese equities.
The economic calendar ahead will bring Australia’s trade balance data in focus. Otherwise, the positive backdrop in the US session and the plunging oil prices could be catalysts for slight relief in the Asia session, although market participants could still be wary of taking on excessive risks moving into the key US job report on Friday.
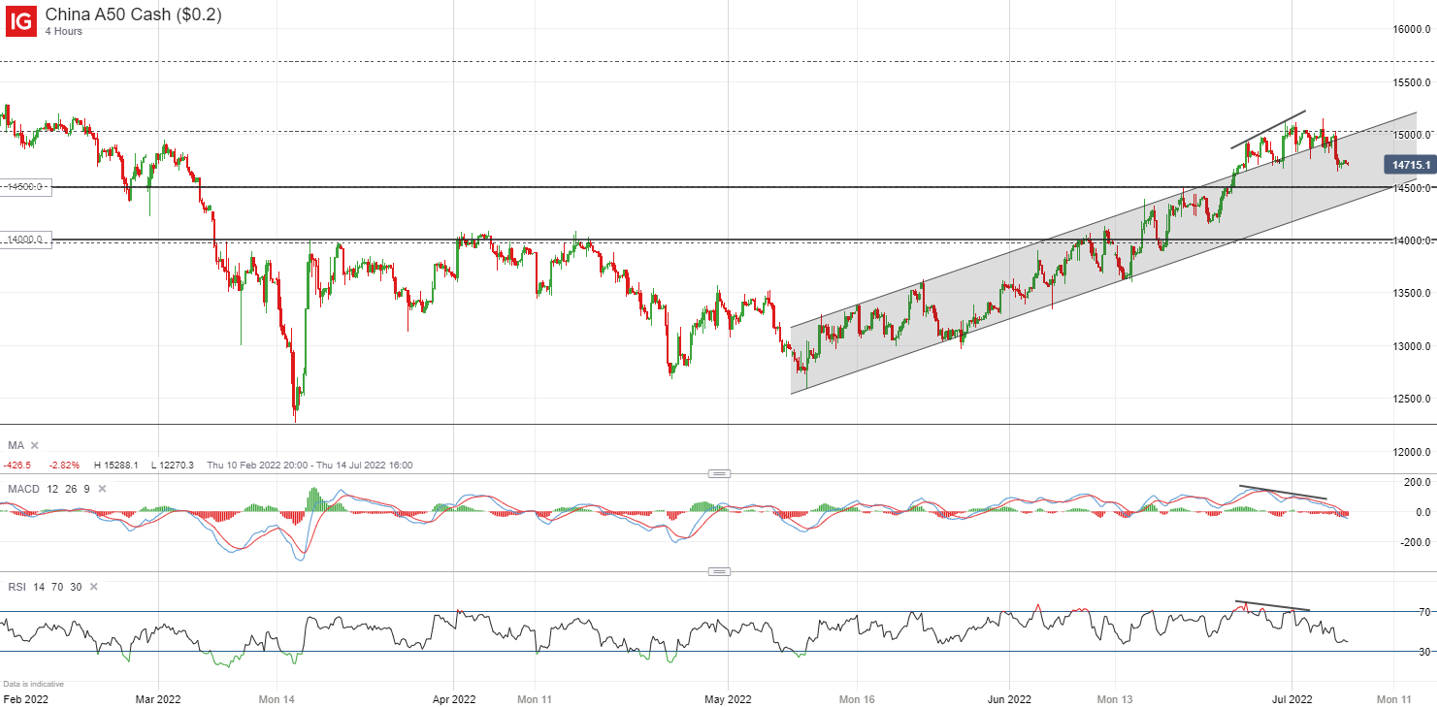
For the China A50 index, after breaking above an ascending channel pattern two weeks back, a retest of the 15,000 level was met with some resistance at a key 61.8% Fibonacci retracement. This could also come as a near-term retracement from a relative strength index (RSI) bearish divergence. Further retracement could leave the 14,500 level on watch next, where a horizontal support lies in place with the lower channel trendline.
 Source: IG charts
On the watchlist: GBP/USD attempting to look past political chaos but downward bias remains
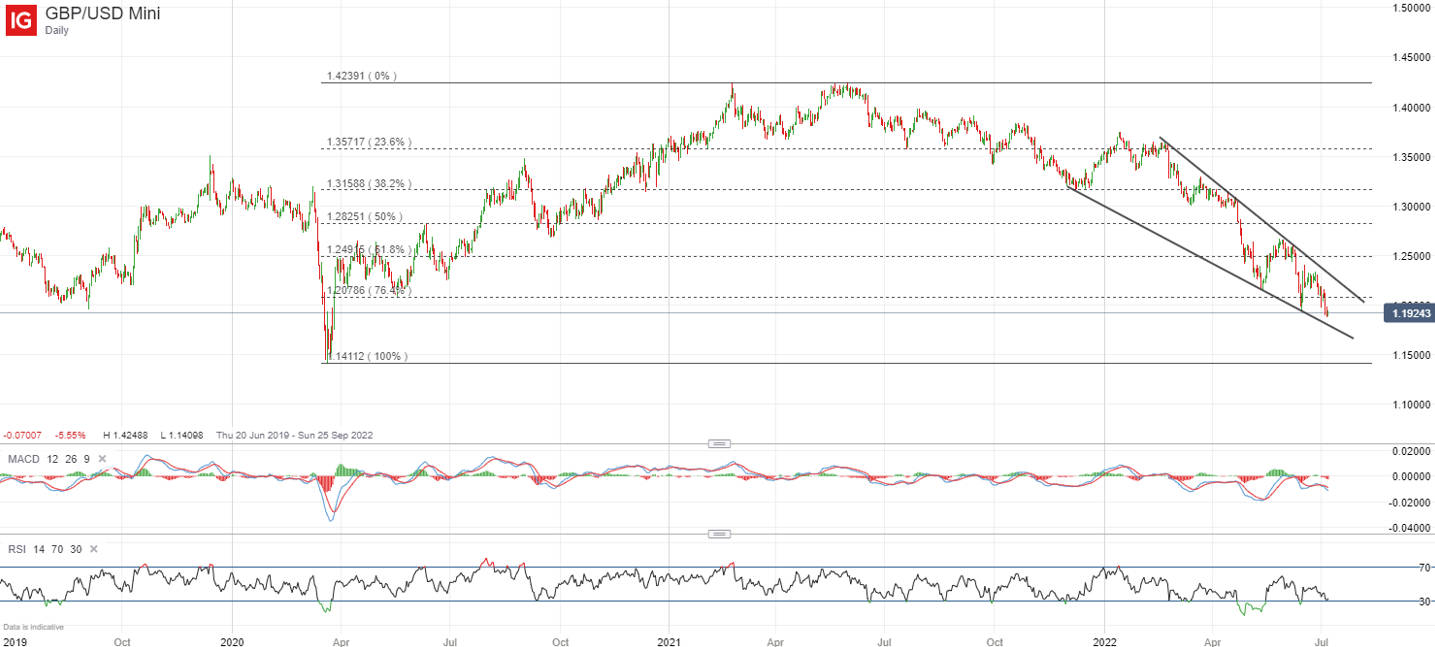
The GBP/USD is currently hanging near its lowest level since March 2020, weighed down by recent US dollar strength and weak growth projections as the trade-off to bring down inflation. The currency pair is attempting to look past the political uncertainty for now with the mass resignations from Boris Johnson’s cabinet, supported by views that the fiscal policy and tax cuts may be a possibility to win back support. That said, the GBP/USD continues to trade with a downward bias, with the formation of a new lower low this week. The pair seems to be trading within a descending wedge pattern since the start of the year and further downside could leave the 1.175 level on watch for potential support from the lower wedge trendline.
 Source: IG charts
Wednesday: DJIA +0.23%; S&P 500 +0.36%; Nasdaq +0.35%, DAX +1.56%, FTSE +1.17%


0 Comments
Recommended Comments
There are no comments to display.
Create an account or sign in to comment
You need to be a member in order to leave a comment
Create an account
Sign up for a new account in our community. It's easy!
Register a new accountSign in
Already have an account? Sign in here.
Sign In Now