Uranium investments look attractive as Sizewell C plant highlights shift to nuclear

Entry posted by ArvinIG in Analyst article
491 views
Sizewell C plant gains approval highlighting the growing case for investment in uranium stocks as the world shifts towards self sufficiency.

Source: Bloomberg
UK power plant approval indicative of wider trend
Today has seen the French energy firm EDF gain approval for their Sizewell C nuclear power plant, as the company seeks to expand on their already established Sizewell B plant in Suffolk. This is a particularly notable breakthrough as it appears to highlight a growing global trend as sentiment softens towards nuclear. Sizewell C has had plenty of opposition in its time, with local protests ensuring that authorities go through four-rounds of consultancy from the inception of the project in 2012.
However, events in Russia have fast-tracked efforts to move towards a more self-sufficient energy mix. Unlike most energy sources, which can be massively influenced by geo-political relationships and pricing fluctuations, the costs associated with a Nuclear power plant are less about the price of Uranium and more the ongoing running costs of running the plant safely. While the plant will face plenty of further opposition, the question of whether EDF get this expansion off the ground is less important than the wider picture for Uranium demand.
Staunch opposition in Japan and Germany starts to turn
While the Sizewell C plan faced opposition from 10,000 East Sussex residents, experiences in Fukushima have ensured that pretty much the entire Japanese population stood against turning the reactors back on. However, that is exactly what their Prime Minister plans to do, with Fumio Kishida requesting that his Minister for Industry gets up to nine nuclear reactors operational by Winter.
Germany is another traditionally staunch critic of nuclear power, with the country providing consistent opposition against efforts within the EU to include nuclear energy as a green sustainable investment in its "taxonomy." However, the evident risk posed by German overreliance upon Russian energy has clearly seen a shift, with the EU finally including Nuclear in their taxonomy which now labels the energy form as being sustainable. This opens the door for European green bonds to invest in nuclear projects for the first time. According to 2021 figures, EDF could have €7.9 billion worth of projects eligible for green funding going forward. That is by far the largest segment in consideration.
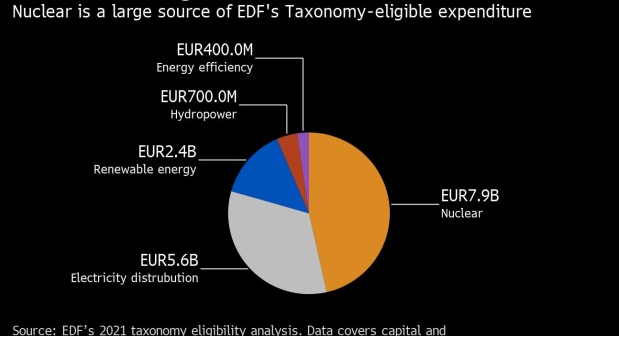
Source: Bloomberg
With global attitudes shifting in favour of nuclear once again, we can expect to see demand for the raw material pick up in the coming years. Supply will also likely expand, although it takes time to get a mine operational once again. Recent talk from the United States over the need to swiftly develop the means to produce uranium concentrate highlight to global push towards building a relatively self-sufficient nuclear industry. As the world transitions towards greater electrification, it is also clear that we cannot continue to burn fossil fuels to create that electricity. Just as the EU have now classified, nuclear largely does allow for the creation of energy in a sustainable manner if produced and stored properly.
While IG does not allow the trade of the underlying Uranium price itself, we can use the Sprott Physical Uranium Trust as a good proxy for underlying price. The comparison below highlights the correlation seen over the course of the past year. We can see that price has largely taken place within a well defined range over much of the past year, with the declines seen throughout global markets helping to dampen elevated sentiment seen in March and April. However, with support coming into play here, the underlying fundamentals behind uranium demand and supply should help elevate prices once again.

Source: TradingView
Yellow Cake
Yellow Cake is the primary uranium investment vehicle in the UK, with the company issuing shares and stockpiling the product over time. We have seen YCA shares similarly head lower over the course of the past three-months, bringing price 28% lower in the process. However, it is notable that price remains above the £2.94 swing-low established in late-February. As long as the price remains above that key pivot level, this stock looks attractive.
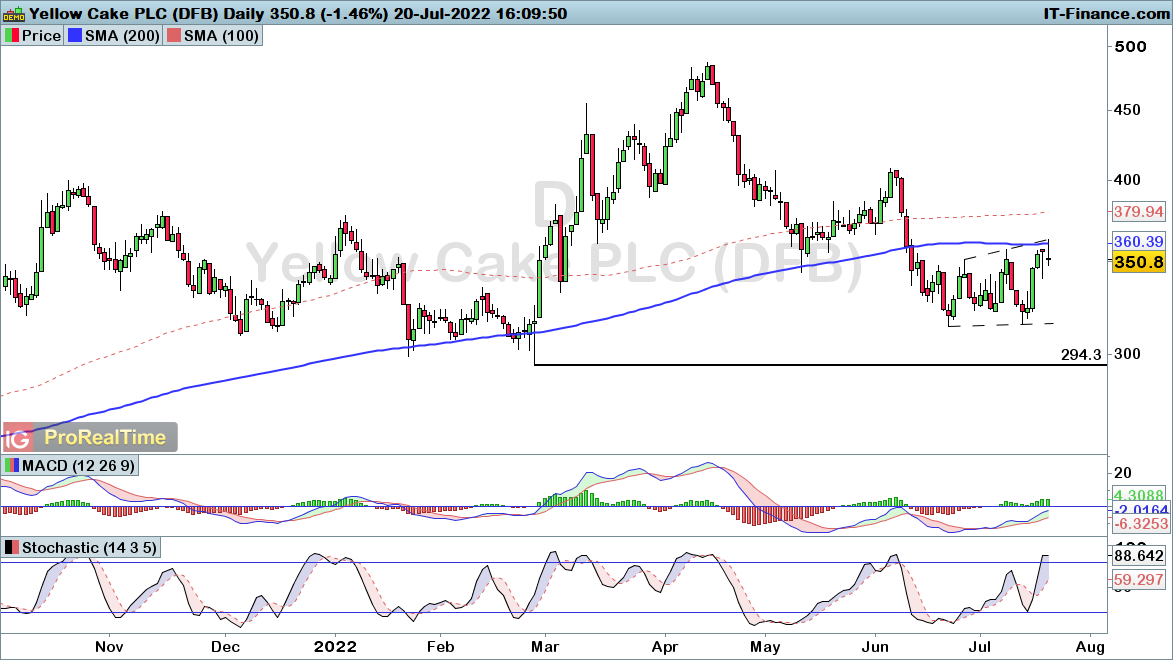
Source: ProRealTime
Cameco
Uranium giant Cameco is another trustworthy name in the field, with the producer clearly trending in the right direction despite recent weakness. That decline takes us to 26% below its April high, yet the uptrend is evident on this weekly chart. With that in mind, bullish positions are favoured as long as the price remains above the $18.02 swing-low.

Source: ProRealTime
Global X Uranium ETF
Looking at the wider uranium space as a whole, the Global X Uranium ETF allows for investment into a wide range of companies involved in the mining of uranium and production of nuclear components. Clearly we can see that things are less clear-cut for the bulls here, with the price looking at risk of rolling over. However, the bullish story still remains in play until we break back below the $17.27 swing-low established last August.

Source: ProRealTime


0 Comments
Recommended Comments
There are no comments to display.
Create an account or sign in to comment
You need to be a member in order to leave a comment
Create an account
Sign up for a new account in our community. It's easy!
Register a new accountSign in
Already have an account? Sign in here.
Sign In Now