What to expect from Nasdaq 100 heavyweight Meta’s (Facebook) Q2 results

Entry posted by ArvinIG in Analyst article
839 views
Meta earnings are expected to contract significantly on an annualized basis in Q2 2022

Source: Bloomberg
When are the Meta results expected?
Meta Platforms (formerly Facebook), the Nasdaq 100 listed social media giant, is set to release second quarter (Q2) results for the fiscal year 2022 (Q2 2022) on 27 of July 2022.
What is ‘The Street’s’ expectations for the Q2 2022 results?
‘The Street’ expectations for the upcoming results are as follows:
- Revenue of $29.04 billion -0.10% year on year (YoY)
- Earnings per share (EPS) $2.61 -27.74% (YoY)
Q2 results are expected to see margin pressures weighing on earnings. The strengthening dollar would have provided a negative input for the repatriation of earnings, particularly from ecommerce/advertising operations in European jurisdictions. This is furthered by the halt of business and services in Russia.
However markets are expecting a softer quarter of earnings. What will be of key interest, is any data on user activity and growth. Facebook is now also seeing stiff competition for screen (marketing) time from younger rivals such as TikTok, as well as long time competitors such as Alphabet (Google / Youtube). In what is becoming a much more saturated marketplace, user activity and growth become key metrics In lieu of the availability of advertising and ecommerce real estate for companies like Meta.
How to trade Meta into the results

Source: Refinitiv
Refinitive data shows a consensus of (61) analyst ratings at ‘buy’ for Meta. A mean of estimates suggest a long term share price target of $280.64 for the company. The current share price trades at a 60% discount to this assumed long term fair value (as of 20 July 2022).
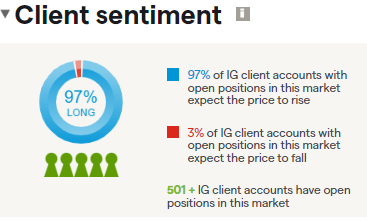
Source: IG
IG sentiment data shows that 97% of clients with open positions on the share (as of 20 of July 2022) expect the price to rise over the near term, while 3% of these clients expect the price to fall.
Meta – Technical view
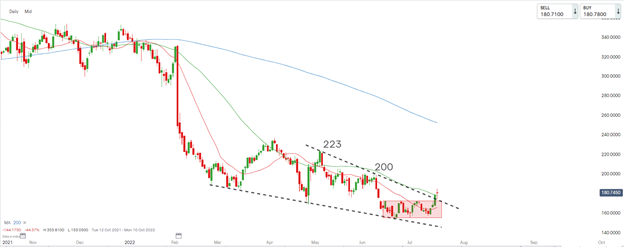
Source: ProRealTime
The long term price trend for the share price of Meta remains down highlighted by the price still trading firmly below the 200 day simple moving average (SMA). However we are starting to see the suggestion of a short term reversal as the price breaks out of a short term range and larger wedge formation. The near term breakout suggests 200 and 223 as possible upside resistance targets from the move.
However for renewed faith in a prolonged uptrend we would like to at least see the 20 day SMA trading back above the 50 day SMA. Until such time, we would continue to look for short entry on any bearish price reversals from the current move higher.
In summary
- Meta is set to release Q2 2022 results on 27 of July 2022
- Q2 2022 results are expected to show a year on year decrease in revenue and EPS
- Long term broker consensus suggests the share to currently be a ‘buy’, with a longer term price target of $280.64
- IG clients with open positions on the share are predominantly long
- The long term price trend for Meta remains down, although we have started to see the price rebounding in the short term
Shaun Murison | Senior Market Analyst, Johannesburg
21 July 2022 21:32


0 Comments
Recommended Comments
There are no comments to display.
Create an account or sign in to comment
You need to be a member in order to leave a comment
Create an account
Sign up for a new account in our community. It's easy!
Register a new accountSign in
Already have an account? Sign in here.
Sign In Now