Daily brief: AUD/USD buoyed by rising Iron Ore prices as traders eye Westpac consumer confidence

Entry posted by ArvinIG in Analyst article
555 views
Asia-Pacific markets face rocky start after a mixed session on Wall Street; Australia’s Westpac consumer confidence eyed as potential risk to AUD and AUD/USD retakes 50-day SMA after overnight gain, but momentum looks fragile.

Source: Bloomberg
Tuesday’s Asia-Pacific outlook
The Australian dollar is searching for direction in Asia-Pacific trading after rising more than 1% overnight. Stocks closed mixed on Wall Street. The tech-heavy Nasdaq-100 Index (NDX) fell, and the small-cap Russell 2000 rose. Rising oil prices helped support energy stocks, with WTI crude oil and Brent oil prices rising more than 2%.
Copper and iron ore prices are higher, aiding the commodity-sensitive Aussie dollar. China’s trade balance data showed a renewed appetite for many commodities in July. Goldman Sachs cut its Brent crude oil price forecast for the third quarter from $110 to $140. Energy traders are watching for monthly reports from OPEC and the International Energy Agency this week, along with inventory data from the API and EIA.
OZ Minerals rejected an unsolicited offer from BHP Group worth A$8.34 billion. The CEO of OZ Minerals appeared unimpressed with the offer, but it is unknown if BHP will adjust its bid. Overall, however, it’s a positive sign for the copper industry. The recent drop in prices does favor the position of larger companies that are likely better capitalized.
New Zealand’s electronic retail card spending fell 0.2% from the prior month in July. NZD/USD climbed above its 50-day Simple Moving Average during New York hours. A move higher in iron ore prices helped support AUD, but prices face a potentially volatile session today, with Westpac consumer confidence due shortly. The gauge has fallen since January, and the RBA’s recent rate hike may have dragged sentiment further.
Notable Events for August 09:
- Philippines – Balance of Trade (June)
- Australia – NAB Business Confidence
- Philippines – GDP Growth Rate QoQ (Q2)
- Thailand – Consumer Confidence (July)
- Japan – 30-Year JGB Auction
- Indonesia – Retail Sales YoY (June)
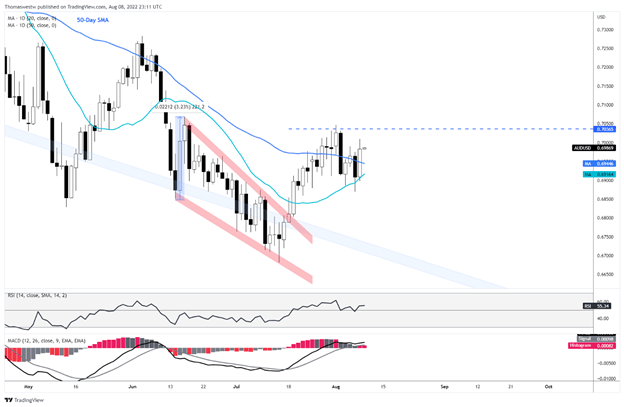
AUD/USD technical outlook
AUD/USD is trading back above its 50-day Simple Moving Average (SMA) after rising from its 20-day SMA. A break above the 0.7036 level may clear a path for more gains. However, RSI and MACD, while positive, have started to moderate. A pullback would aim for support around the 20- and 50-day SMAs.
AUD/USD daily chart
This information has been prepared by DailyFX, the partner site of IG offering leading forex news and analysis. In addition to the disclaimer below, the material on this page does not contain a record of our trading prices, or an offer of, or solicitation for, a transaction in any financial instrument. IG accepts no responsibility for any use that may be made of these comments and for any consequences that result. No representation or warranty is given as to the accuracy or completeness of this information. Consequently any person acting on it does so entirely at their own risk. Any research provided does not have regard to the specific investment objectives, financial situation and needs of any specific person who may receive it. It has not been prepared in accordance with legal requirements designed to promote the independence of investment research and as such is considered to be a marketing communication. Although we are not specifically constrained from dealing ahead of our recommendations we do not seek to take advantage of them before they are provided to our clients.


.jpeg.98f0cfe51803b4af23bc6b06b29ba6ff.jpeg)


0 Comments
Recommended Comments
There are no comments to display.
Create an account or sign in to comment
You need to be a member in order to leave a comment
Create an account
Sign up for a new account in our community. It's easy!
Register a new accountSign in
Already have an account? Sign in here.
Sign In Now