Crypto mania: What now for DogeCoin, NFTs and other digital assets?

Entry posted by ArvinIG in Analyst article
1,127 views
We have a look at what's going on with DogeCoin, what's happened to the value of NFTs, and the state of digital assets.
Financial bubbles can only be seen in hindsight. Though the signs can be witnessed at the time, it’s only when things pop that a bubble can truly be defined. Whether it’s tulips, housing, tech stocks or something else, a euphoric rise in prices is so often followed by a fall. In this week’s Crypto Verse, we take a look at some of the frothier areas of the crypto sphere, with a special look at what’s happening right now with Dogecoin.
Reflecting on the bubble and bust
Looking back, it was all so clear. The rally in everything that saw just about every asset in the world soar carried crypto-assets to heights not seen in its history - and thrust words like blockchain and non-fungible tokens into public consciousness, and phrases like mooning and diamond hands into the financial vocabulary.
Like any boom, there had to come a bust, with an aggressive pivot in policy from the US Federal Reserve at the end of 2021 draining the bullishness from crypto-assets. Bitcoin prices dropped as much as 75% and threaten to fall further. Many alt-coins - many of which with names you’d feel sheepish about uttering to your financial advisor - crashed, including the high-profile Luna. A handful of brokers and exchanges, like Celsius, went bust, with many traders’ money taken with it.
The state of Bored Apes and other NFTs
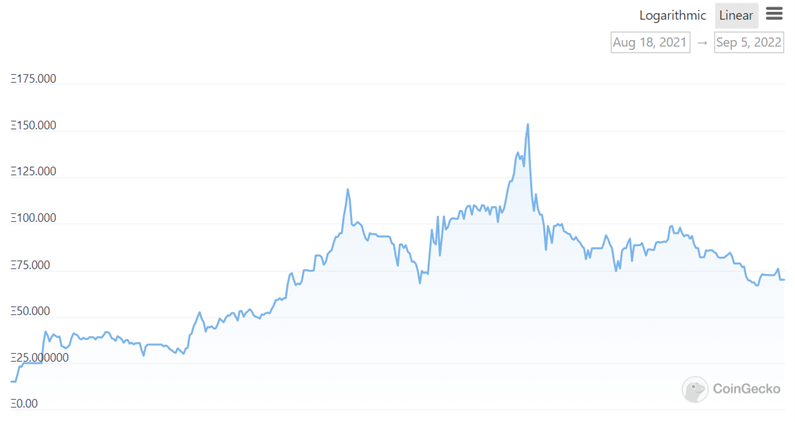
Source: CoinGecko
Like anything in the crypto-universe, the essence and function of non-fungible tokens were overwhelmed by rampant financial speculation in 2021. A mechanism by which to secure and verify information or an asset on the blockchain, the emergence of digital art held on an NFT attracted extraordinary sums of money to the space. Of course, like anything in the art world, prices can be driven by nefarious activities like tax evasion and money laundering.
One of the most high-profile sales was of work done by digital artist Beeple, who sold a piece for an eye-watering $US69 million.
While the work’s current value is difficult to ascertain, other transactions in recent months show a monumental drop in the value of NFTs. An NFT of Jack Dorsey’s first tweet sold for just $280 earlier this year, after selling for $2.9 million in March 2021.
The Bored Ape Yacht Club, which counts the likes of Justin Bieber and Shaquille O’Neal as members, has fallen by over half from its peak.
Jokes over: what's happening with DogeCoin?

Source: Bloomberg
The original alt-coin and perhaps explicitly meme trade was DogeCoin. It was created in 2013 by Bill Markus and Jackson Palmer explicitly as a joke, but still functions as a peer-to-peer payments platform, with some businesses accepting Doge as payment. The key difference with a counterpart like Bitcoin is DogeCoin does not have a finite supply, meaning that in principle, there’s no scarcity and is of diminishing value.
There are several high profile advocates of DogeCoin, chiefly amongst them Tesla CEO Elon Musk, who owns the coin, and has claimed he’d be more greatly invested if it weren’t for a small number of “whales” who own most of the crypto and can therefore dictate its price. Musk has major influence over the price, moving it often via his personal Twitter. Incidentally, the value of DogeCoin hit its peak after Musk appeared on Saturday Night Live, and labelled it “a hustle”.
Technical analysis of DogeCoin
DogeCoin is a clear downtrend, and is off by around 90% since Elon Musk’s SNL performance. The set-up looks increasingly bearish for the crypto, with the recent drop in risk-assets moving price with its prevailing downtrend. Major support is around $0.05, which if broken, could invite greater selling from traders. Resistance can be found around a confluence of levels around $0.09 - $0.10, which may offer attractive risk-reward to fade any rally.
Of course, particular caution should be taken when trading DogeCoin because of its high volatility and relative illiquidity.
DogeCoin daily chart
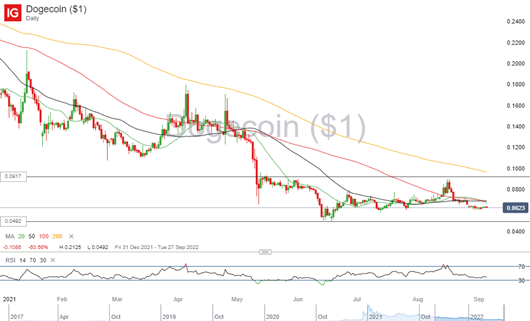
Source: IG


0 Comments
Recommended Comments
There are no comments to display.
Create an account or sign in to comment
You need to be a member in order to leave a comment
Create an account
Sign up for a new account in our community. It's easy!
Register a new accountSign in
Already have an account? Sign in here.
Sign In Now