Biggest ever FTSE 250 annual underperformance versus FTSE 100

Entry posted by MongiIG in Market News
572 views
The FTSE 250 is taking the brunt of the cost-of-living crisis and recession fears with it heading towards its biggest ever annual underperformance versus FTSE 100.
 Source: Bloomberg
Is the FTSE 250 heading towards its biggest ever annual underperformance against the FTSE 100?
The cost-of-living crisis, rising input prices and the British pound sterling’s slide to 37-year lows have all had a detrimental effect on earnings and means that the FTSE 250 is on track for its the biggest ever annual underperformance versus the FTSE 100.
The FTSE 250, which unlike the blue-chip FTSE 100, is made up of the 101st to 350th largest UK companies listed on the London Stock Exchange (LSE) and is more UK focused as they carry out more of their business in the UK than abroad, is considered a better indication of the health of the British economy than its bigger brother.
The FTSE 250’s historic underperformance is worrying market participants and is another indication that a recession is probably looming, as productivity growth has halved since the early 2000s, real wages are falling and an aging population is placing a growing strain on already stretched public services.
According to Bloomberg the FTSE 250 is showing its largest annual underperformance recorded to date versus the FTSE 100 which is being supported in part by energy firms and mining stocks which have benefitted from booming commodity markets, and exporters who have been helped by the pound’s dramatic slide.
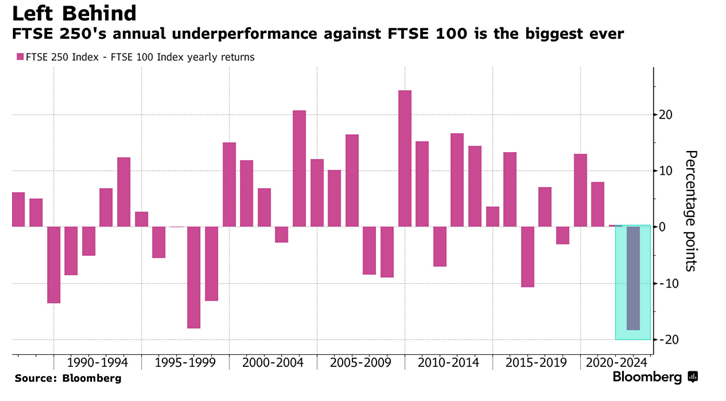
The FTSE 250 has taken the brunt of the UK’s high inflation, which is forecasted to peak between 13%, Bank of England (BoE) forecast and 22% (Goldman Sachs), and its impact on UK growth with the index trading down by around 22% year-to-date compared to the FTSE 100’s less than 4% decline.
Could the UK’s new prime minister’s energy bill cap reverse the FTSE 250’s fortunes?
The new UK prime minister Liz Truss’ plan of an energy bill cap at current levels for household support, and a business energy package, which are projected to cost an eye-watering £130 billion for the former and £40 billion for the latter – compared to the £70 billion which the Covid-19 furlough cost – may reduce peak inflation to around 11% before it is expected to trail off next year.
The pledged rescue package may help stabilise the UK economy in the short term at a time when it is facing a deteriorating labour market and persistent elevated price pressures linked to the soaring cost of energy but won’t be able to solve all of the UK’s post Covid-19 pandemic and post-Brexit woes.
Rapidly rising interest rates which filter through to higher mortgage rate repayments, for example, create another blow to demand and thus earnings of UK companies, especially those in the FTSE 250.
Technical Outlook for the FTSE 250
 Source: IT-Finance.com
The FTSE 250 revisited a key support zone made up of the March and July lows at 18,509 to 18,289 in early September with it holding on this occasion.
Since the close to 10% decline from its mid-August high has been swift and momentum seems to be clearly skewed to the downside, the odds are that the above-mentioned support area will be retested in September and may then give way.
 Source: IT-Finance.com
Such a scenario would be technically bearish for the FTSE 250 with the 61.8% Fibonacci retracement of the 2020-to-2022 bull market at 16,93 and the September 2020 low at 16,739 being targeted.
For any kind of bullish reversal to gain traction, a rise and daily chart close above the 55-day simple moving average (SMA) and the 26 August high at 19,367 to 19,416 would need to be seen. Unless this happens, the last few weeks’ steep downtrend remains firmly entrenched.


.jpeg.98f0cfe51803b4af23bc6b06b29ba6ff.jpeg)


0 Comments
Recommended Comments
There are no comments to display.
Create an account or sign in to comment
You need to be a member in order to leave a comment
Create an account
Sign up for a new account in our community. It's easy!
Register a new accountSign in
Already have an account? Sign in here.
Sign In Now