Likelihood of higher-for-longer rates brought to the forefront once more: Nasdaq 100, Nikkei 225, Gold

Entry posted by MongiIG in Market News
512 views
Hotter-than-expected August inflation print in the US had overturned hopes of a quicker Fed policies’ pivot, with talks of a 100 basis-point hike in September on the table.
 Source: Bloomberg
Market Recap
The hotter-than-expected print for both US headline and core inflation in August delivered a negative shock to Wall Street overnight by suggesting that pricing pressures are not moderating as fast as expected while overturning hopes of a quicker Federal Reserve (Fed) policies’ pivot. Rate hike expectations were being ramped up after the data release, with markets now fully pricing for a 75 basis-point (bp) hike in next week’s Federal Open Market Committee (FOMC) meeting and a 33% chance is being attributed to a 100 bp scenario. Terminal rate currently sits on the 4.25%-4.50% camp, an upward shift in expectations from the 3.75%-4.00% before the data release.
Overall, the likelihood for higher-for-longer rates is once again brought to the forefront and is clearly not well received by risk assets. The US dollar trade is back in the spotlight with a 1.5% gain, while Treasury yields were broadly higher. The two-year yield is at its highest level since 2007 at 3.8%. Ahead, the upward revision in terminal rate could drive the US 10-year yields to retest its 3.50% top in June this year, translating into downward pressure for the equity markets. On the flipside, gold prices have given back its past week’s gains, while the S&P 500 and rate-sensitive Nasdaq have wiped out their past four days of gains in a single night.
Looking at the Consumer Price Index (CPI) data, US headline inflation increased 0.1% month-on-month (MoM), in what was widely expected to be a decrease. The core aspect revealed some stickiness as well, rising 0.6% from July which is double the expected rate of 0.3%. Year-on-year (YoY), headline and core readings stand at 8.3% and 6.3% respectively (expectations were for 8.1% and 6.1%). Despite seeing a 10.6% moderation in gasoline prices from July, the negative effect was offset by an increase in shelter costs (+0.7%), which accounts for about one-third of the CPI weighting. This follows as rental costs generally come with some lagging effects (around 6-18 months), although US home prices have already seen some growth moderation over the past two months. That said, pricing pressures were also presented in medical care (+0.8%), new vehicles (+0.8%) and utility payments (+1.5%), painting a more persistent process in tackling inflation.
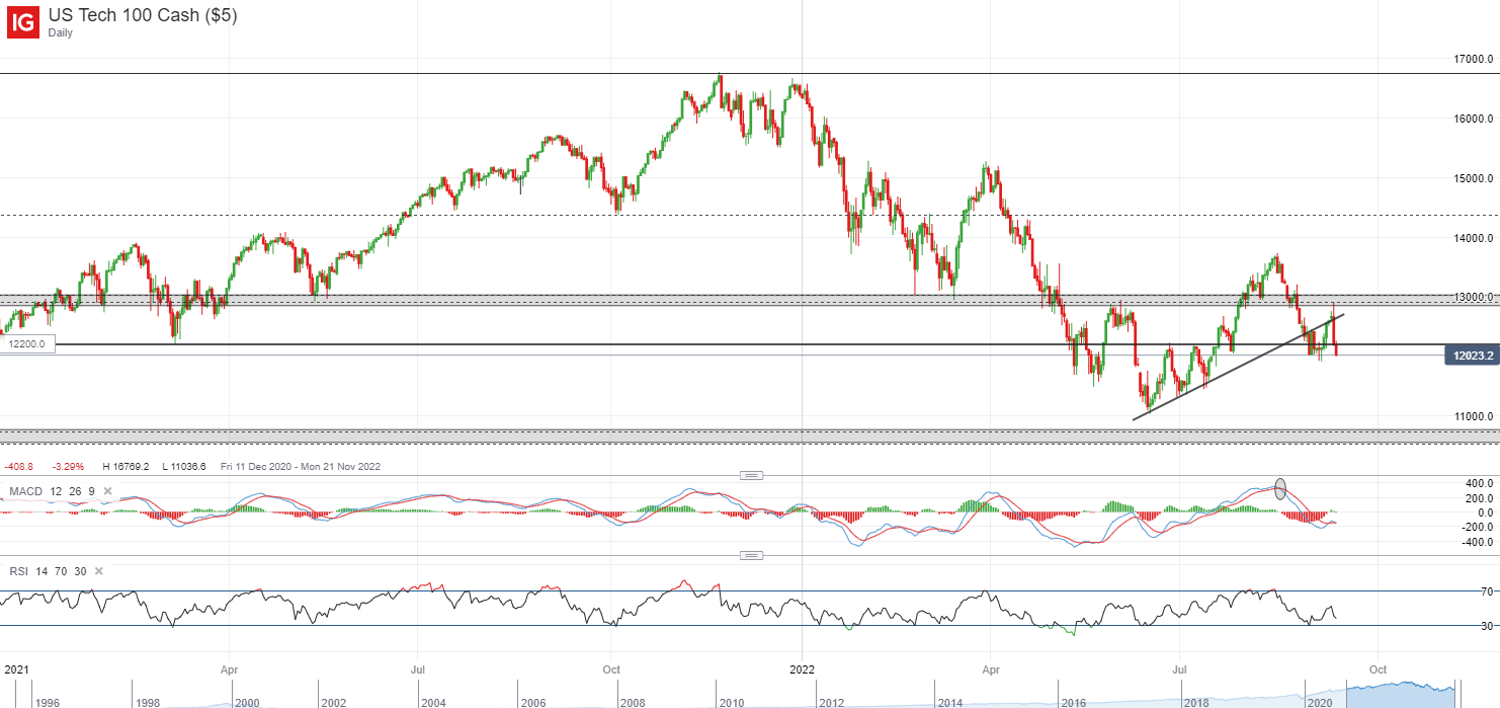
After retesting a confluence of resistance at the 12,900-13,000 region, along with an upward trendline resistance, the Nasdaq 100 has given way with yesterday’s sell-off wiping out its past week’s gains. The formation of another near-term lower high translates to an overall downward bias. This could potentially leave the 11,680 level on watch next.
 Source: IG charts
Asia Open
Asian stocks look set for a negative open, with Nikkei -2.73%, ASX -2.68% and KOSPI -2.45% at the time of writing. Past week’s recovery was riding on some expectations that further downside in inflation could be baby steps towards steering Fed policymakers’ views, but the hotter US inflation print has left the Fed’s tightening process well-anchored for now. The knock-on impact from the negative lead in Wall Street is driving a risk-off mood in the Asia session as well, with headwinds ranging from a stronger US dollar and higher Treasury yields not providing any catalyst of relief.
The economic calendar ahead will bring a series of Japan’s economic data. This morning’s release has seen an outperformance in machinery orders (+12.8% YoY), which is almost double the 6.6% expected. That presented a more resilient recovery in Japan for business spending, with recent plans to further reopen its borders in October providing an anchor for consumer spending. That said, the economic resilience could be overlooked for now as overall risk sentiments may revolve around the market rout in US, with the Nikkei 225 generally more sensitive to moves in US. The whole narrative will continue to be about inflation, with inflation readings out of UK released later today. No slack in pricing pressures is expected on that front. The US Producer Price Index (PPI) will be released later tonight as well, potentially serving another reminder of more persistent inflation ahead.
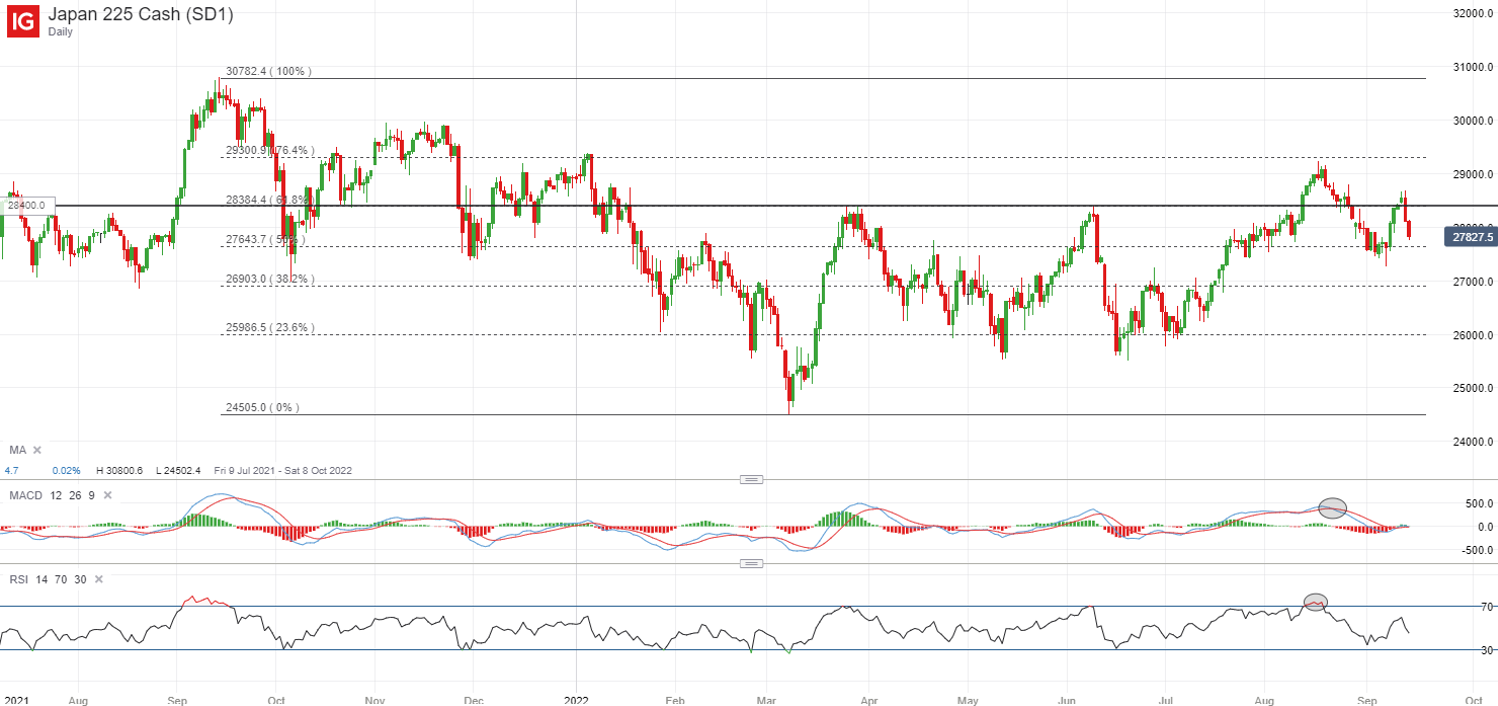
A recent rebound coming after a bullish hammer candlestick last week seems to be short-lived, after the index failed to overcome the 28,400 resistance level. Current downward move is moving to challenge previous dip-buying efforts at the 27,600 level, where a key 50% Fibonacci retracement level stands. Failure for the level to hold could draw further downside to the 27,000 level next, where a 38.2% Fibonacci retracement level stands as near-term support.
 Source: IG charts
On the watchlist: Gold prices moving back to retest July bottom
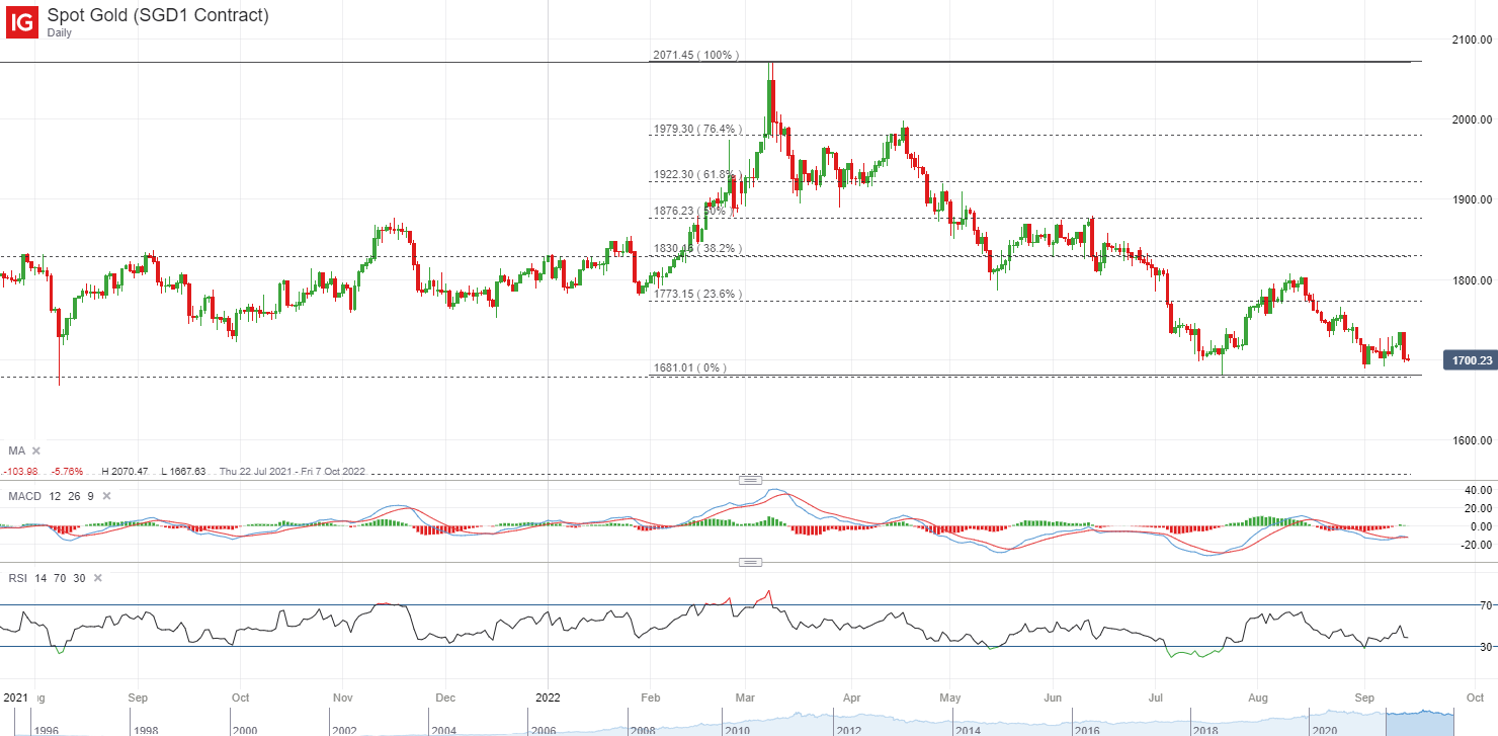
The upward revision in interest rate expectations serves as a headwind for non-yielding gold, with its prices giving back all of its past week’s gains. The Commodity Futures Trading Commission (CFTC) data suggests that net-long positioning for money managers continue to hover at levels on par with its 2015 bottom last week, but with the higher-for-longer stance for rates seeing no clear relief, prices have not been able to gain much traction. This will leave the US$1,680 level on watch as near-term support. Failure for the level to hold could open the door for further downside towards the US$1,560 level next.
 Source: IG charts
Tuesday: DJIA -3.94%; S&P 500 -4.32%; Nasdaq -5.16%, DAX -1.59%, FTSE -1.17%


0 Comments
Recommended Comments
There are no comments to display.
Create an account or sign in to comment
You need to be a member in order to leave a comment
Create an account
Sign up for a new account in our community. It's easy!
Register a new accountSign in
Already have an account? Sign in here.
Sign In Now