Jump to content

Apple stock: is now the time to buy?


ArvinIG

616 views

Even though September is often when Apple shines but things are a bit different this year.

1664240421656.png
Source: Bloomberg


Apple’s new strategy

September 7th, 2022 saw Apple Inc unveils its 2022 lineup of smartphones and digital assets. The launch includes a base model iPhone 14, a larger Plus version, the 14 Pro, and the 14 Pro Max.

The gap between the base and the Pro model is apparent with the Pro models receiving a 48-megapixel camera upgrade, a much faster A16 Bionic chip, a new always-on-display feature and a 35% higher charge. The upgrades and improvments in the iPhone are all designed to fit into Apple's new strategy.

What does the new strategy mean for Apple?

This new strategy has the potential to be a game changer for Apple.

Over the previous years, the lower-priced iPhones usually did well in sales and this was evident during the second quarter of 2022 when Apple sold about 37% more of the base model iPhone 13 and 13 Mini than the two Pro versions.

But for the new series, the expectation is that the iPhone 14 Pro and iPhone 14 Pro Max will account for 50 to 60% of total shipments for the rest of the year with the iPhone 14 Pro Max, the most expensive version, anticipated to make up 30 to 35% of sales alone.

This new product strategy, if successful, will not only help Apple to seize more market shares, an area where Samsung is leading at the moment but more importantly, will help the company enjoy higher margins to combat the inflation headwinds.

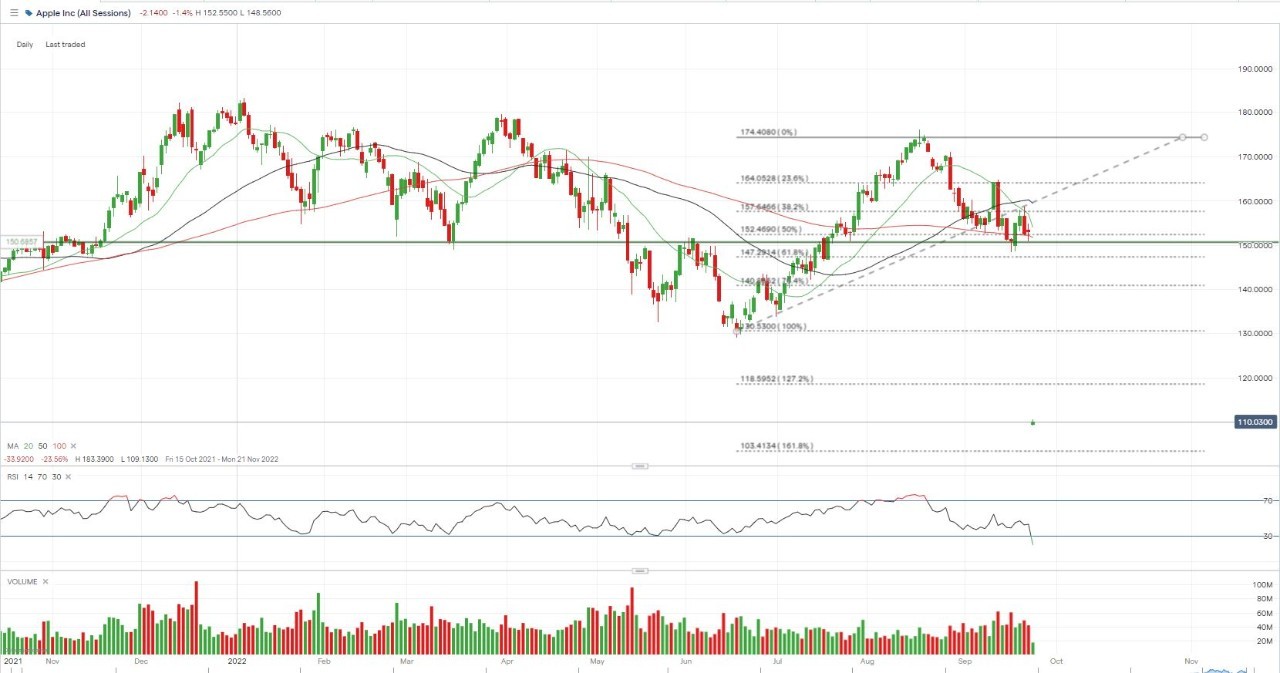
Apple’s share price and technical analysis

Over 2022, Apple's share price has declined 18% and only a further 15% since August 18th.

However, despite a slightly questionable performance, it is still safe to say Apple remains a company investors can count on. Given its robust business and financial performance, the recent dip in prices doesn't change the fact that shareholders have received enviable returns over the last five years, at around 300%.

The share price for Apple has been working hard to stabilize the ground around the 100-day moving average after the recent decline to a two-month-low. That brings the price back to the crucial $150 level signalling the potential for further downside.

However, with the price dipping deep into the oversold territory, we could see the possibility that selling pressure should ease soon.

Even so, with an overall bearish sentiment in play, it may be too optimistic to expect a quick turnaround. A rise through the $154 level, where the 20-day MA sits, would be required to negate this bearish short-term view.

Apple daily chart

1664240421710.JPG
Source: IG

Hebe Chen | Market Analyst, Melbourne
27 September 2022

0 Comments


Recommended Comments

There are no comments to display.

Create an account or sign in to comment

You need to be a member in order to leave a comment

Create an account

Sign up for a new account in our community. It's easy!

Register a new account

Sign in

Already have an account? Sign in here.

Sign In Now
  • Blog Statistics

    • Total Blogs
      3
    • Total Entries
      2,821
  • Latest Forum Topics

  • Our picks

    • Are these the best AI stocks to watch in May 2024?
      Microsoft, Apple, Nvidia, Amazon and Meta could be the best AI stocks to watch next month. These stocks are the largest AI stocks in the US based on market capitalisation.
    • Natural Gas Commodity Elliottwave Technical Analysis
      Natural Gas


      Mode - Impulsive 


      Structure - Impulse Wave 


      Position - Wave (iii) of 5


      Direction - Wave (iii) of 5 still in play


      Details:  Price now in wave iii as it attempts to breach 1.65 wave i low. Wave (iii) is still expected to extend lower in an impulse.


      Natural Gas is currently breaching the previous April low, marking a decisive move as the impulse initiated on 5th March continues its downward trajectory, further extending the overarching impulse wave sequence that commenced back in August 2022. This decline is anticipated to persist as long as the price remains below the critical resistance level of 2.012.


      Zooming in on the daily chart, we observe the medium-term impulse wave originating from August 2022, which is persisting in its downward trend after completing its 4th wave - delineated as primary wave 4 in blue (circled) - at 3.666 in October 2023. Presently, the 5th wave, identified as primary blue wave 5, is underway, manifesting as an impulse at the intermediate degree in red. It is envisaged that the price will breach the February 2024 low of 1.533 as wave 5 of (3) seeks culmination before an anticipated rebound in wave (4). This confluence of price movements underscores the bearish sentiment prevailing over Natural Gas in the medium term.


      Analyzing the H4 chart, we initiated the impulse wave count for wave (3) from the level of 2.012, which marks the termination point of wave 4. Notably, price action formed a 1-2-1-2 structure, with confirmation established at 1.65 and invalidation set at 2.012. The confirmation of our anticipated direction materialized as price breached the 1.65 mark, signifying a resumption of bearish momentum. Presently, there appears to be minimal resistance hindering the bears, thereby reinstating their dominance in the market. It is projected that wave iii of (iii) of 5 will manifest around 1.43, indicative of the potential for the wave 5 low to extend to 1.3 or even lower. This comprehensive analysis underscores the prevailing bearish outlook for Natural Gas in the immediate future.


      Technical Analyst : Sanmi Adeagbo
       
        • Like
    • Meta Platforms’ earnings round-up: Share price plunged despite 1Q beat
      Meta’s share price plunged as much as 16% in post-market trading, following the release of its 1Q 2024 results.
×
×
  • Create New...
us