The four-hour trader, a full trading plan

Entry posted by ArvinIG in Educational
937 views
Traders can implement a well-heeled plan taking only four hours per week; the four-hour chart can be ideal for Forex traders looking to trade around the clock and we outline a full plan based around Price Action.

Source: Bloomberg
All of the sudden, the world has gotten very small; and life is moving faster than ever before.
The internet presents a lot of benefits to the human species; but time management is not one of them. As competition for page views, viewer numbers, and attendance continues to heat up, very little in this life emphasis a slow and steady approach.
But to the trader, in many cases, that is the best way to go about speculation in markets: Slow, steady, and consistent.
But being there as a trader, and getting there as a new speculator are completely different markets. In this article, we’re going to outline a complete trading plan that will take less than four hours of a trader’s time each week. And further, this is an approach that can be focused on longer-term moves, and swings.
If you have a day job, or any other pre-existing commitments that limits your time on charts, this is an approach that can offer quite a few benefits.
-
The center of the approach
The four-hour chart plays a special role in the FX market.
Most equity markets are open between eight and nine hours each day, and as such, the four-hour chart might take on less importance. After all, a four-hour chart just shows two bars for each trading session, so traders might as well just look at the daily chart.
But in the Forex market, the four-hour time frame takes on special importance. The market never closes, and traders are literally Trading the World. The four-hour candle represents half of each geographic trading session. Each of these sessions can take on markedly different tones, and that is where traders can look for potential opportunities.
In the FX market, traders are truly ‘Trading the World’
Source: Trading the World
Traders can use the price movements and gyrations on these four-hour charts to analyse markets and find potential pockets of opportunity.
Watch for the close of each four-hour candle that you can.
Using the New York close to define ‘financial time’ means that we’re seeing candles close at 5, 9, and 1 AM and PM (based on ET). If you’re using Central Time, that’s 4, 8, and 12 AM/PM while Pacific Time is 2, 6, and 10 AM/PM.
If you’re busy at the time, mobile applications can generally offer you what you need to perform the analysis at the close of each of these candles.
Traders can then take a ten-minute block of time upon the close of each of these four-hour candles to look for potential trade setups, while also using this as an opportunity to manage risk.
If the trader is awake for four of the six four-hour candles that form each day that would mean that the trader would need approximately 40 minutes per day to analyse charts. If time permits, an additional 10-15 minutes can be used at or around the daily close.
The total time commitment required is 40-50 minutes each day, for a total of 200-250 minutes per week (240 minutes is 4 hours).
-
Use price action to locate the strongest trends
Trends in markets can be easily graded and seen with price action… by simply looking for charts to make progressively higher-highs, and higher-lows (in the case of an uptrend), and lower-lows, and lower-highs (for downtrends).
Price action can help traders locate the strongest trends
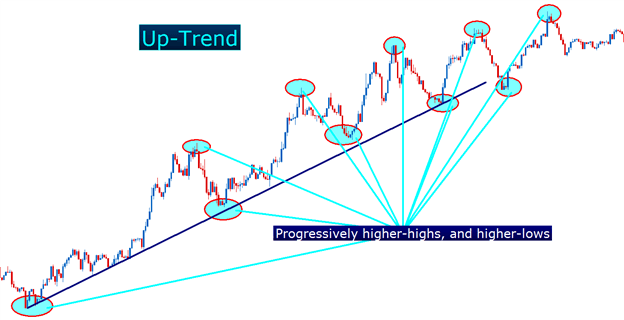
In the article Price Action, an Introduction we look at a way that traders can grade trends without the use of any indicator at all, using just past prices.
Traders want to look to trade in the direction of these trends; buying up-trends, and selling down-trends. But, is it enough to just buy up-trends or sell down-trends and ‘hope’ that they continue? No. Traders can use price action to appropriate their entries into these positions.
-
Use price action to buy up-trends cheaply, and sell down-trends expensively
Once a strong trend has been located, the trader can then look to plot their entry by looking for a ‘trigger’ into the position via price action.
Once again, traders want to look to efficiently buy up-trends when price is cheap, or near support. We looked at how traders can find this support in the article, Price Action Swings.
-
Traders can look to buy up-trends after a recent swing low
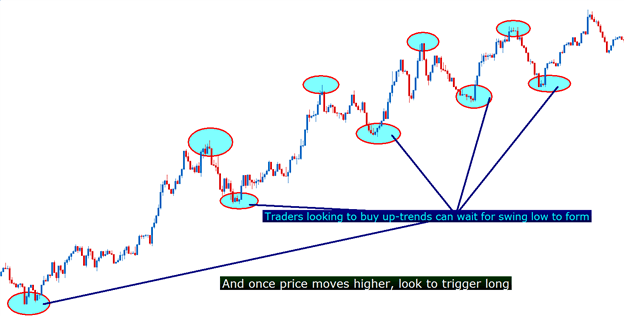
Traders can look for additional confirmation of the entry by looking to the price action candles that form at or around those swings.
We looked at quite a few of these triggers in Trading Bearish Reversals (for down-trends), and The Hammer Trigger for Bullish Reversals (for up-trends).
Traders can look for bullish triggers at or around recently printed new lows
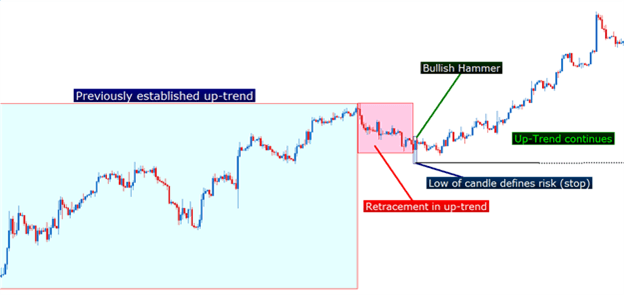
Source: The Hammer Trigger for Bullish Reversals
-
Use stops and limits to enforce favourable risk-reward ratios
One of the main premises of our price action education is that future prices are unpredictable, and as such, there is no such thing as a ‘holy grail’ or ‘can’t lose’ strategy.
By adding a stop and limit, and letting the trade work – the trader eliminates the possibility of making a knee-jerk reaction that they may end up regretting. It also enforces a favorable risk-reward ratio, and puts traders in the most promising spot to avoid the number one mistake that Forex traders make.
-
Trade management
Since traders are looking at their charts for each four-hour bar, they have built-in trade management for each position that they take on.
Traders can use the close of each four-hour candle as an opportunity to adjust stops (particularly the break-even stop), or to take profits while also looking to trigger new positions.
Traders can take this a step further by trailing their stop in an effort to lock in gains in the event that the trend gets especially built-in. We looked at this premise in Trading Trends by Trailing Stops with Price Swings.
Traders can lock up gains to maximize trends

Source: The Hammer Trigger for Bullish Reversals


0 Comments
Recommended Comments
There are no comments to display.
Create an account or sign in to comment
You need to be a member in order to leave a comment
Create an account
Sign up for a new account in our community. It's easy!
Register a new accountSign in
Already have an account? Sign in here.
Sign In Now