Cautious start to the week in the lead-up to US inflation data: GBP/USD, China A50, Gold
A largely quiet economic calendar overnight drove markets to follow through with its negative momentum from last week, as the repricing for the upward shift in interest rate expectations continues.
 Source: Bloomberg
Market Recap
A largely quiet economic calendar overnight drove markets to follow through with its negative momentum from last week, as the repricing for the upward shift in interest rate expectations continues. Greater underperformance were seen in the energy (-2.06%) and technology (-1.56%) sectors. The former struggles with a 2% pull-back in oil prices while the US semiconductor industry remains in the midst of digesting the recent sweeping new export rules to China. The PHLX Semiconductor Index fell by another 3.5%, coming after a more than 6% plunge last Friday.
Comments from JPMorgan CEO Jamie Dimon overnight also provided little to cheer, with his warning of a likely US and global recession by mid-2023 coming at a time when the Federal Reserve (Fed) remains firm on its tightening stance. The warning of the rising risk for a global recession was also reiterated by the heads of the International Monetary Fund and World Bank. Sentiments towards the latter half of the session were slightly uplifted by words from Fed Vice Chair Lael Brainard, who maintained the stance for monetary policies to be restrictive but signalled some caution for global risks outlook. This seems to be interpreted as carrying some tint of dovishness with growth conditions on the radar for policymakers, although it clearly fell short of any indication of a policy pivot. The day ahead will bring a line-up of speeches from central banks once more, all likely to signal a restraint from lifting their foot off the tightening pedal, while overall risk environment could remain cautious in the lead-up to the US inflation readings. The US dollar continue to tick higher (+0.21%) overnight, although the more measured increase from last week could suggest some receding strength.
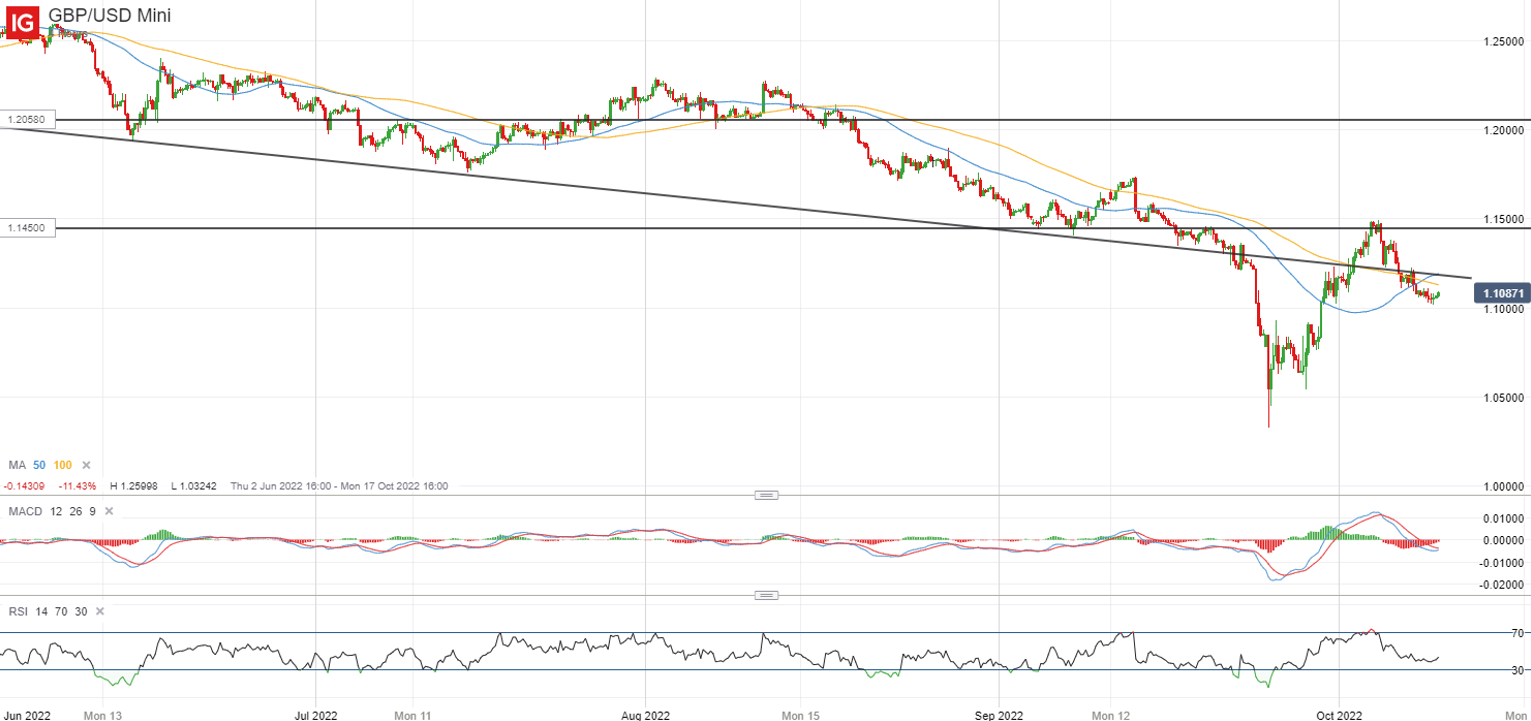
Over in the UK, further commitment by the Bank of England (BoE) to its emergency purchase program failed to calm markets as its bond yields continued on its upward trajectory. Further follow-up action by the central bank in terms of rate hikes seem more likely than not, with a whole percentage point being priced for the November meeting. For now, the GBP/USD seems to remain in a downward trend with the formation a new lower high on its recent recovery. The 1.120 level will be a key resistance to overcome, which marks a longer-term downtrend line. A break back above its previous peak at 1.150 may be warranted to signal a greater revival of confidence in the British authorities, absence of which may suggest that the pair will continue to carry an overall downward bias.
 Source: IG charts
Asia Open
Asian stocks look set for a mixed open, with Nikkei -1.79%, ASX +0.29% and KOSPI -2.41% at the time of writing. Coming back from its holiday break, Japan and South Korea markets are catching up to previous global market losses, with their exposure to the tech sector spurring a greater extent of sell-off as mirrored in Wall Street. Japan also reopens for tourism today after two years of Covid-19 restrictions, where pent-up travel spending could provide a lift for its recovery, although recovery could still remain vulnerable to the global moderation in economic conditions and inflationary pressures on its firms and consumers. In Australia, the release of the Westpac-Melbourne Institute index of consumer sentiment saw a 0.9% dip in October, but one is finding comfort that this could be a more positive outcome with the toning down of rate hikes from the Reserve Bank of Australia (RBA) last week. That said, the overall outlook still leans towards a more downbeat mood, as sentiments will continue to be driven by the global risk environment.
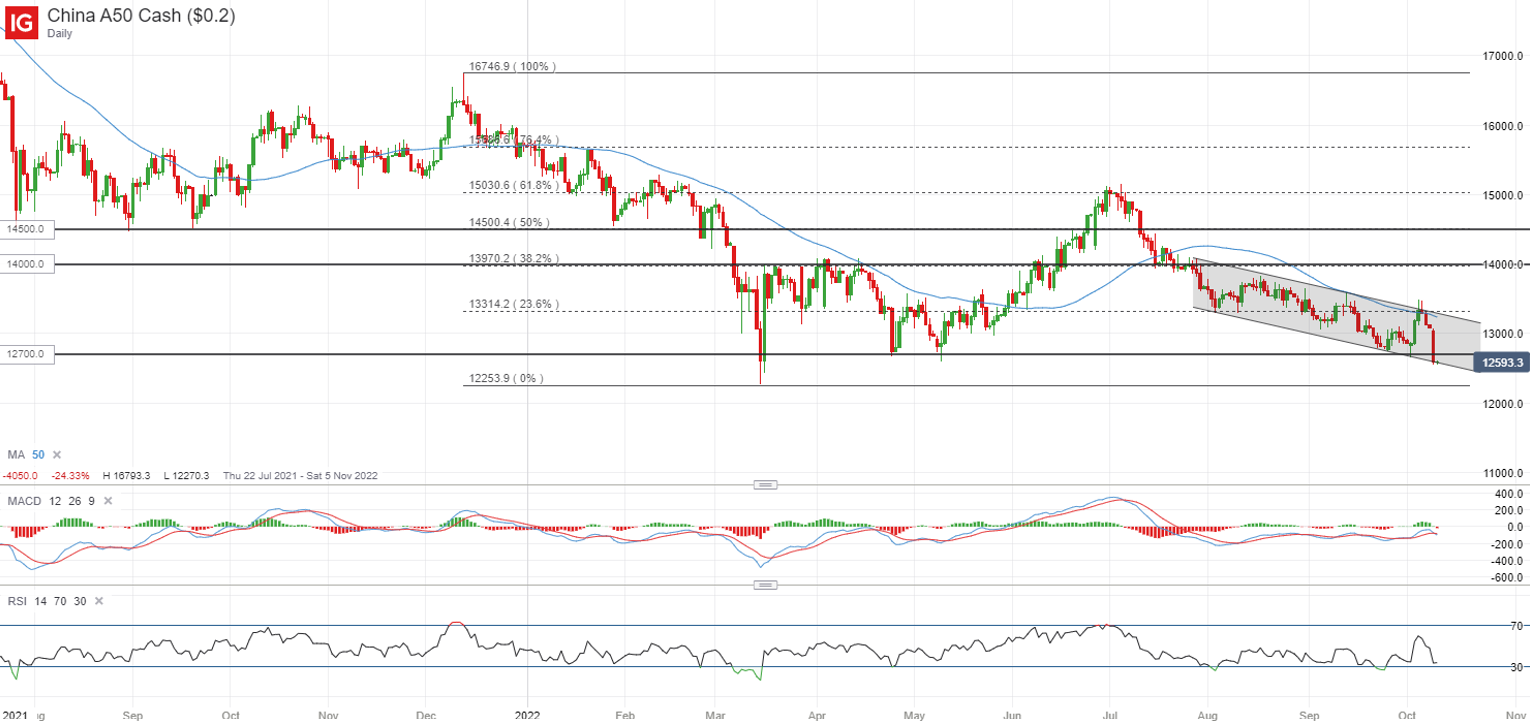
Yesterday’s catch-up performance after the Golden Week holiday has dragged the China A50 index lower by 3.5%, breaking to a new six-month low. Downbeat economic data continues to reflect the weighing impact from its zero-Covid-19 policy, while spending from China’s Golden Week has proved to be disappointing. The trade data on watch this week is likely to reinforce the lower-for-longer economic picture as well. Recovery in sentiments could potentially come next week with its 20th National Congress, where further calls of policy support may provide a much-needed boost. However, a key focus could be on its zero-Covid-19 stance and if the meeting failed to provide assurances of a way out of its virus policies, upside could still be more of a knee-jerk reaction. For the index, the March bottom is currently being retested, in coincidence with a channel trendline support. Failure to hold could leave the 12,253 level in sight next.
 Source: IG charts
On the watchlist: Gold prices remains stuck in a descending channel pattern
A previous rally in gold prices from Fed’s policy pivot bets has come to a halt, as prices continue to take its cue from the build-up in rate hike expectations from last week, which were brought on by the hotter-than-expected US job report. Gold has been trading within a descending channel pattern since March this year and a failed break of its upper channel trendline resistance, along with its 50-day moving average (MA), has pushed prices back below the US$1,680 level. This level marks a significant level of support in underpinning prices on at least five previous occasions. That will leave its previous September bottom on watch at the US$1,618 level if upcoming US inflation data continues to disappoint. Longer-term, an upward break of the channel may be warranted to denote a more sustaining shift in sentiments to the upside.
 Source: IG charts
Monday: DJIA -0.32%; S&P 500 -0.75%; Nasdaq -1.04%, DAX +0.07%, FTSE -0.45%


0 Comments
Recommended Comments
There are no comments to display.
Create an account or sign in to comment
You need to be a member in order to leave a comment
Create an account
Sign up for a new account in our community. It's easy!
Register a new accountSign in
Already have an account? Sign in here.
Sign In Now