Initial gains in Wall Street failed to hold: GBP/USD, USD/SGD, USD/JPY

Entry posted by MongiIG in Market News
538 views
Major US indices failed to hold onto their initial gains, with dip buyers struggling to find a positive catalyst to drive a more sustained upside for now.
 Source: Bloomberg
Market Recap
Major US indices failed to hold onto their initial gains, with dip buyers struggling to find a positive catalyst to drive a more sustained upside for now. Market watchers were looking towards the US producer price index (PPI) data as a preview for the consumer inflation data up ahead and the upside surprise being presented sparked some caution that consumer prices may come in above expectations as well. To recall, US producer prices rose 0.4% month-on-month (MoM) in September versus the 0.2% forecast. Although good prices have seen some moderation, a jump in prices for services contributed to the persistence in wholesale inflation. This will keep the Federal Reserve (Fed)’s foot firmly on the tightening pedal, with the higher-for-longer stance further reiterated in the Federal Open Market Committee (FOMC) minutes overnight.
The minutes revealed a consensus among policymakers to raise rates to a more restrictive level and to maintain them there for some time. Growth risks are shown to be on some policymakers’ radar, with their view to ‘calibrate’ the pace of further hikes to reduce the impact on the economy. That said, the resolve to tame inflation clearly remains the key focus thus far and overshadowed these growth concerns, although one to watch if these concerns will continue to build over the coming months.
For now, the fate for markets will lie on the upcoming US consumer price index (CPI) data. Current expectations are pointing to further moderation in headline inflation (8.1% from previous 8.3%), but a worrying sign for an uptick in the core aspects (6.5% from previous 6.3%). With equity markets desperately looking for an opportunity for a bounce, matching or coming in below expectations will be looked upon to trigger a relief rally.
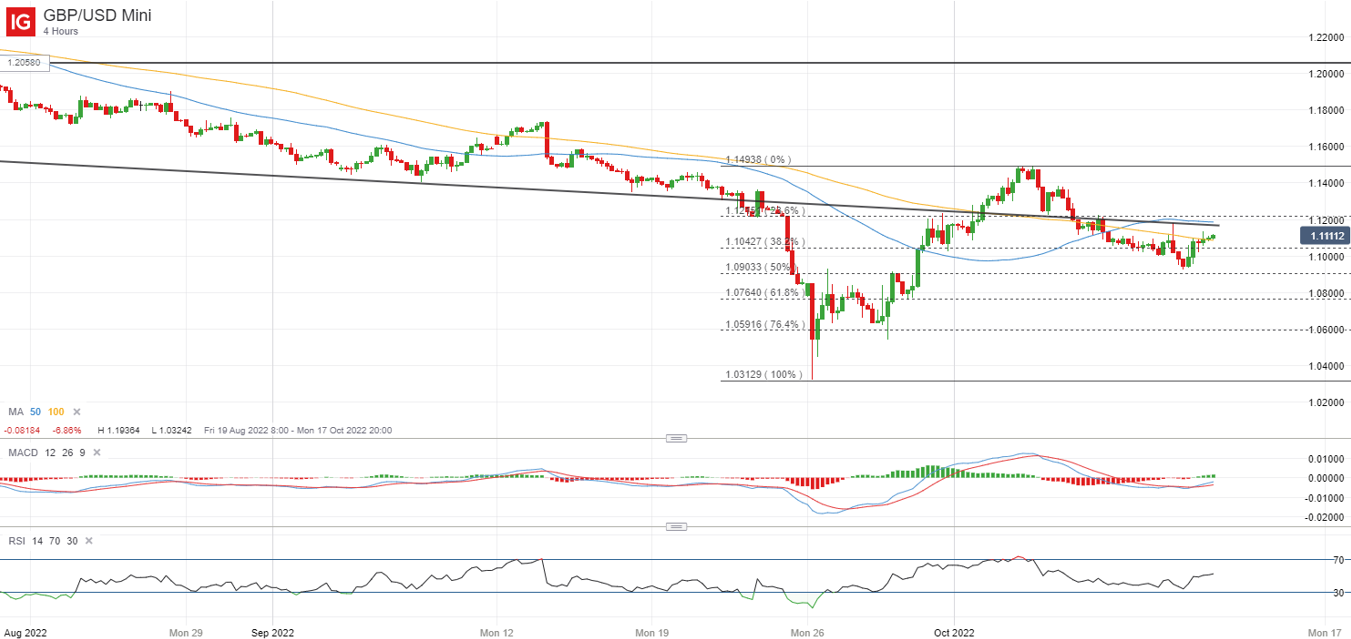
Over in the UK, the policy flip-flop continues as news of the Bank of England (BoE)’s willingness to extend its emergency bond-buying program were overturned. The reaffirmation for this Friday’s deadline drove longer-term gilt yields higher, although some resilience in the pound seems to reflect some expectations that the central bank will be bound to come to the rescue if needed. For now, the 1.120 level will be a key resistance to overcome, with the confluence of a previous downward trendline resistance and a key 23.6% Fibonacci retracement. A greater resistance will be at its previous peak at the 1.150 level, where the level has to be overcome to denote a more concrete revival in market confidence.
 Source: IG charts
Asia Open
Asian stocks look set for a mixed open, with Nikkei -0.12%, ASX +0.38% and KOSPI -0.52% at the time of writing. The lead-up to the key US inflation data is seen driving a more cautious mood around the region, with some wait-and-see being presented in US Treasury yields and US dollar movements as well. The relatively quiet economic calendar in the region plays a part as well. For now, the inflation fight has proved to be far from over. India’s September inflation data surprised slightly to the upside yesterday (7.41% versus 7.3% forecast), with food prices being the main culprit for the more persistent pricing pressures. Japan’s PPI data for September surpassed expectations this morning as well, with year-on-year (YoY) growth at 9.7% and towering way above the 8.8% forecast. While the data is less looked upon, the potential pass-through in rising costs to consumers may pose as an increasing challenge to the Bank of Japan (BoJ)’s accommodative policies, although its recent reaffirmation suggests that easy policies will stay over the coming months at least.
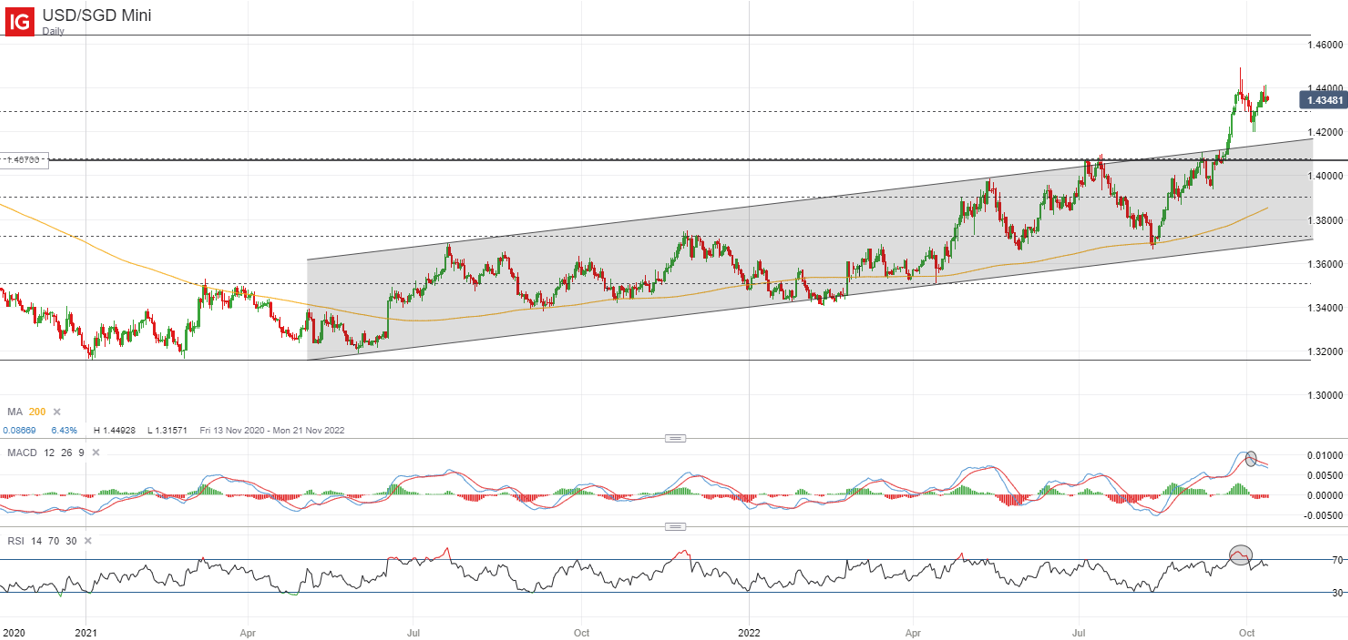
We will be getting the Money Authority of Singapore (MAS) monetary policy statement tomorrow, along with the advance estimate for Singapore’s quarter three (Q3) gross domestic product (GDP). Singapore’s higher vulnerability to imported inflation translates to greater pressure for the MAS to keep up with its tightening, while its September headline inflation showed no signs of peaking at 7.5%. This will mark the fifth tightening attempts since October last year. The debate will revolve around whether the central bank will deliver a single or 'double-barrelled' move. While the Singapore dollar (SGD) has been more resilient against its regional peers, it is not spared from the US dollar strength, with the upward trend for the USD/SGD firmly intact. A move below the 1.420 level could be warranted to suggest a clearer reversal in sentiments. This level is where previous dip-buying has been spotted at the start of the month and a close below it could validate a double-top pattern as well.
 Source: IG charts
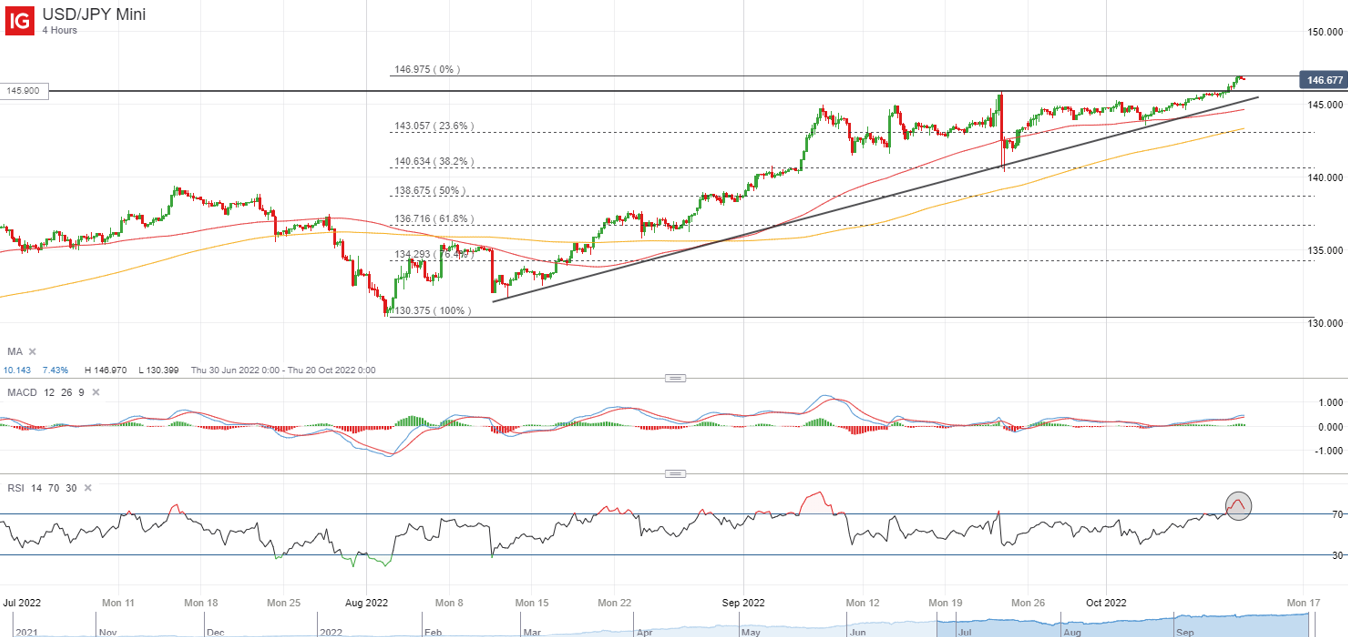
On the watchlist: BoJ challenged with USD/JPY above the 145.90 level
The BoJ is getting tested once more, as the USD/JPY pushed above the 145.90 level, which marks a previous level of intervention by the central bank back on 22 September. This brings the pair to a new 24-year high, with increasing yield differentials being the main catalyst for driving the upward pressure. The central bank’s US$1.2 trillion foreign reserves provides room for further rundown so it may be the question of when we will see further intervention coming in play. Looking ahead to the US CPI print later today, the strong recovery in the US dollar over the past week seems to reflect some building expectations for a higher-than-expected print and failure to deliver on that front could drive an aggressive unwinding in dollar longs. Any retracement in the USD/JPY may leave the 145.00 level on watch as near-term support.
 Source: IG charts
Wednesday: DJIA -0.10%; S&P 500 -0.33%; Nasdaq -0.09%, DAX -0.39%, FTSE -0.86%


0 Comments
Recommended Comments
There are no comments to display.
Create an account or sign in to comment
You need to be a member in order to leave a comment
Create an account
Sign up for a new account in our community. It's easy!
Register a new accountSign in
Already have an account? Sign in here.
Sign In Now