Kardashian, Musk and Do Kwan: three scandals that rocked the cryptoverse

Entry posted by MongiIG in Market News
416 views
We look at the Do Kwan scandal, Musk’s DogeCoin ‘hustle’, and the SEC slapping the wrist of Kim Kardashian. What is the impact of regulation and clampdowns on cryptocurrency and cryptocurrency promotion.
As digital assets have grown and become a bigger part of financial markets, authorities are becoming stricter and more aware of bad behaviour in the industry. In this week’s Crypto Verse, we look at some recent indiscretions in the crypto space and discuss what it might mean for crypto assets going forward.
The manhunt for Do Kwon
Where in the world in Do Kwon?
The Terra Luna founder is on the run from authorities and is wanted in 195 countries, having fled Singapore recently due to the risk of being extradited back to South Korea. Interpol has also issued a 'red notice' for Kwon. He’s wanted for the collapse of the Terra Luna network, which wiped out $US60 billion worth of tokens he created.
The case is perhaps the first and biggest of its kind and puts under the microscope the investor protections crypto-founders are obligated to apply. Given the lack of clearly defined regulation, especially across borders, in crypto markets, any punishment of Do Kwon – assuming he can be found and trialled – will create a new precedent for the asset class.
SEC throws the book at Kim Kardashian
Pump and dump schemes are nothing new to the crypto universe. Given the unregulated nature of the industry, the act of ramping up a token’s price before selling it is common. This behaviour has typically applied to chat rooms amongst small-time actors. With the boom in crypto-prices, marketing particular tokens – especially using influencers – has become increasingly common.
Perhaps in a bid to set an example, the US Securities and Exchange Commission (SEC) announced it settled on a $US1.26 million fine with Kim Kardashian, for failing to disclose payment she received to promote EthereumMax. The case is being seen as a way for the SEC to stamp out the promotion of cryptocurrencies – an act that is illegal for other financial assets – while slow and porous regulation of the emerging asset class comes together.
 Source: Bloomberg
DogeCoin jumps on Musk’s Twitter backflip
Arguably, the biggest pump and dump in crypto-currency history was that performed by Elon Musk with DogeCoin. During the crypto-mania of early 2021, Musk – mostly via Tweet – promoted the supposed virtues of DogeCoin, ramping up his praise leading into his infamous appearance on Saturday Night Live, during which he called the token a 'hustle'. The event marked the top of the market for DogeCoin.
Curiously, DogeCoin’s price popped last week after Musk announced he’d be moving forward with the acquisition of Twitter, perhaps on speculation he might use the social media site as a payment platform that could include the token.
Bitcoin technical analysis
Price action for Bitcoin is bearish. The trend is skewed to the downside, as risk-taking is crushed by the prospect of an evermore aggressive US Federal Reserve. There are some signals the bulls might point to for a possible bottoming in the price of Bitcoin. Technical support at the previous cycle is proving very strong. The weekly RSI is indicating a possible bullish divergence. And, arguably, price is carving out a long-term descending wedge pattern.
 Source: TradingView
Ethereum technical analysis
After the massive 'buy-the-rumour-sell-the-fact' event that was the Ethereum network’s 'merge', Ether’s price has been controlled by the sellers. The crypto’s downtrend remains in place, with risk seemingly skewed to the downside. Ethereum’s 20-week moving average is acting as resistance, while the 200-week moving average is a strong level of support. Below that, a major level of support sits around $850.
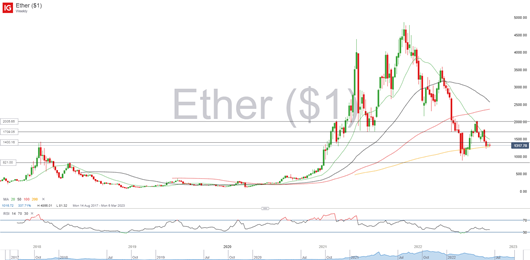 Source: IG
Dogecoin technical analysis
The price of Dogecoin has been ranging after hitting its post-Musk-on-SNL low in June. Dogecoin’s price has oscillated around its 20-day moving average while finding resistance at its 50 and 100-day moving averages. The crypto is clearly in a downtrend, though the RSI is pointing to slight upward momentum. Support could be around 0.056 and resistance around 0.066.
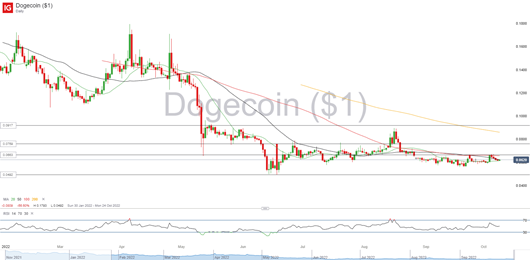 Source: IG


0 Comments
Recommended Comments
There are no comments to display.
Create an account or sign in to comment
You need to be a member in order to leave a comment
Create an account
Sign up for a new account in our community. It's easy!
Register a new accountSign in
Already have an account? Sign in here.
Sign In Now