Bank of Japan (BoJ) preview: Yen intervention continues to be challenged

Entry posted by MongiIG in Market News
441 views
The BoJ is set to hold their monetary meeting across 27 – 28 October 2022, with Japan’s authorities’ intervention thus far failing to deter yen weakness.
 Source: Bloomberg
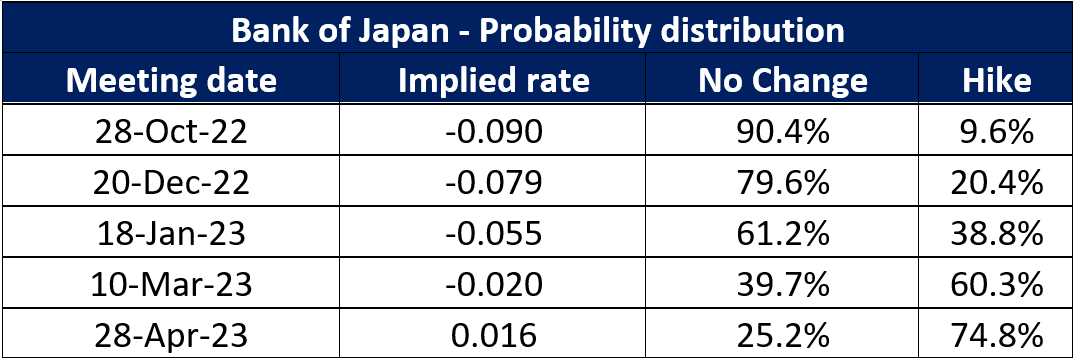
No-change in policy stance, but mounting expectations for rate hike next year
Once again, current market expectations are leaning towards a no-change in policy stance for the upcoming meeting, with the easing stance expected to last for the rest of the year. Only a mere 9.6% probability is being priced for a 0.10% hike this week. That said, with global central banks pressing on with their policy-tightening process, it seems like a matter of time before the Bank of Japan (BoJ) may eventually budge from its ultra-loose monetary policies. Market pricing currently suggests that the March 2023 meeting could be the day of reckoning, where a rate hike may be delivered.
 Source: Refinitiv
Recent months have seen market participants challenging the central bank’s determination in keeping its yield curve control policy, with the 10-year government bond yields attempting to head above the 0.25% ceiling on multiple occasions. Thus far, the central bank has managed to defend the rise with another round of bond-buying last week, which should provide testament that their stance to maintain their accommodative policies will remain at least for now. That said, mounting doubts that its easy stance can maintain for longer have been reflected through the surge in other longer-term and shorter-period yields to their multi-year highs. This comes as the yen continues to face a difficult time in holding off the US dollar strength, while Japan’s September inflation at 3% shows another move ahead of the central bank’s target. At the upcoming meeting, an upward revision in the inflation forecast seems likely with the release of its updated Outlook Report, potentially translating to greater calls for a policy pivot sooner than later.
How has yen intervention played out so far?
Thus far, intervention efforts seem to show that the moves may limit the ascent of the USD/JPY at best, rather than reversing the present upward trend. Last Friday, estimates suggested that a record 5.4 trillion-5.5 trillion yen (US$36.16 billion-US$36.83 billion) was spent in another round of yen-buying intervention, almost double the 2.8 trillion yen on 22 September. While Japan’s huge pool of foreign reserves at US$1.23 trillion may provide the firepower for more intervention, constant drawdowns of such scale for its reserves may still seem unsustainable over the long run. With Japanese authorities recently leaving markets with the uncertainty on when or whether they have stepped in to intervene, it seems that they are shifting towards more of a psychological tactic to deter yen speculators rather than a head-on plan to stem yen decline.
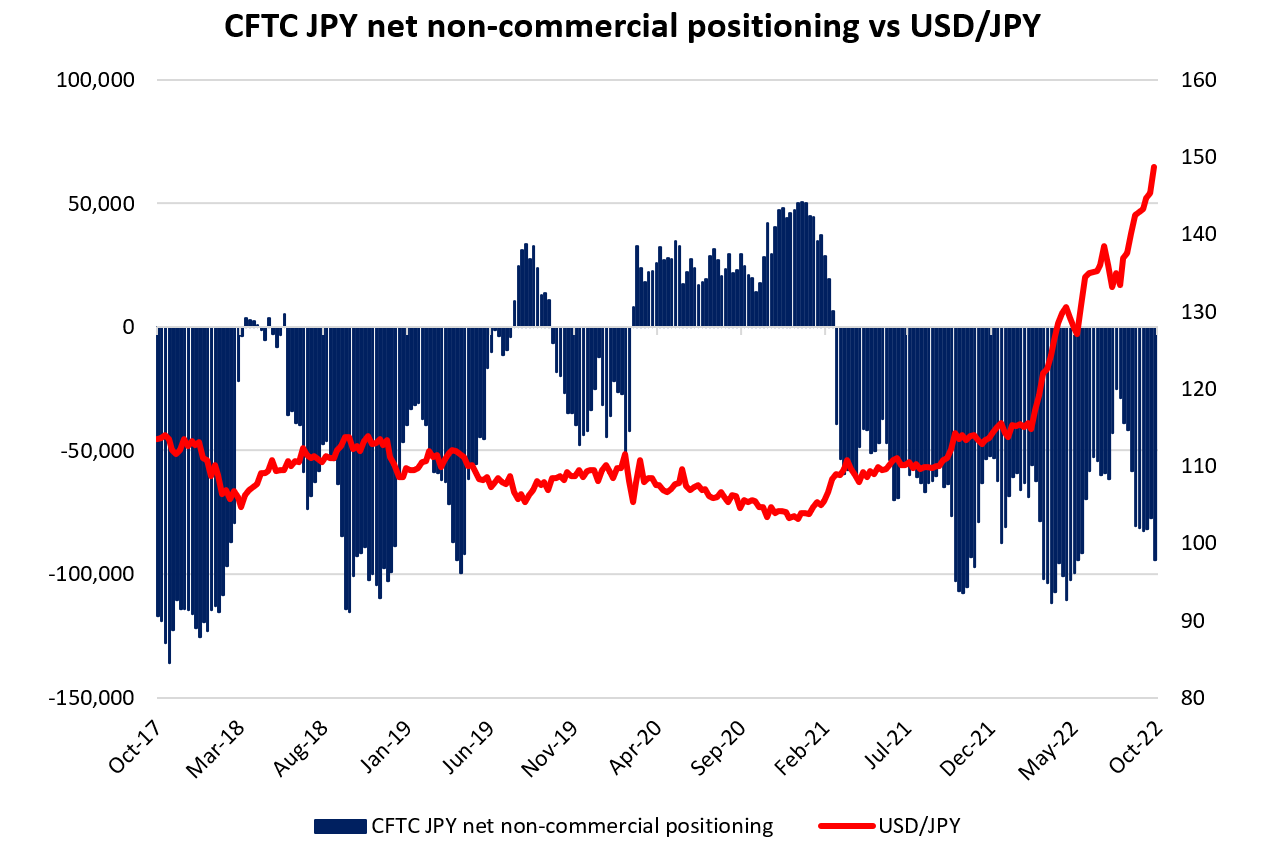
Previous Commodity Futures Trading Commission (CFTC) data revealed that intervention efforts on 22 September this year have done little in reversing the heavy net-short positioning among speculators, with past week’s data even showing further build-up in net shorts among speculators to a four-month high. It may seem that speculators will continue to pit themselves against the Japanese authorities, until we are able to see a policy shift from the BoJ or a pause in rate hikes from the US Fed.
 Source: CFTC Commitment of Traders
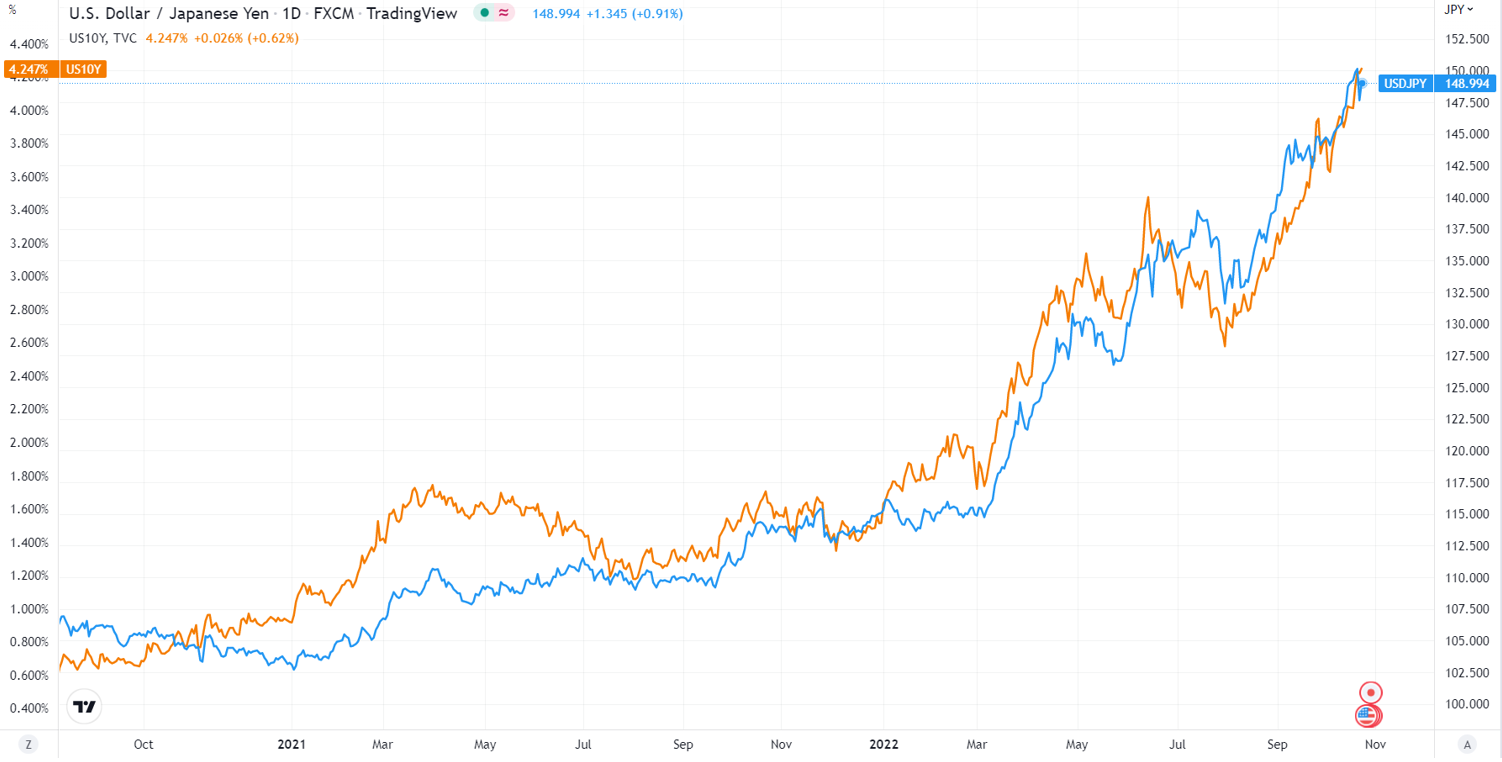
USD/JPY: Still a story of yield differential on policy divergence
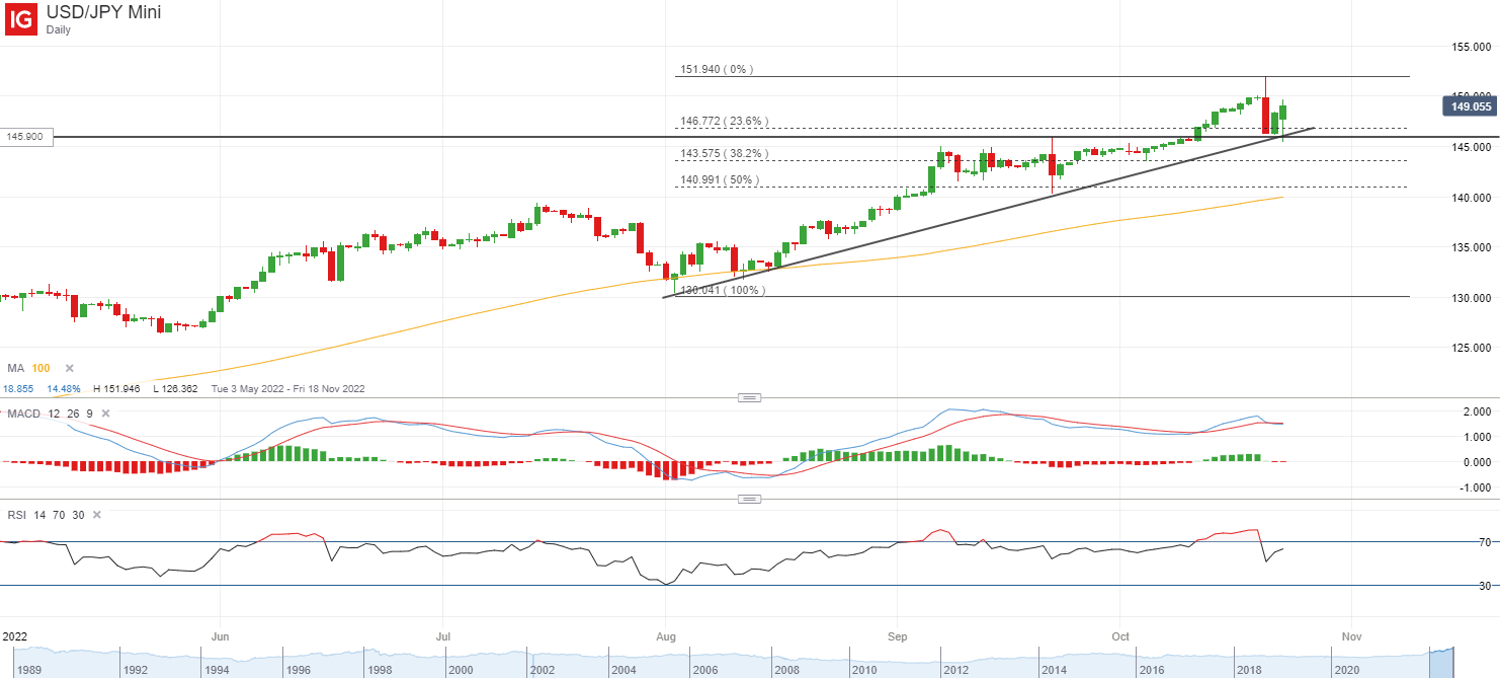
A further move higher in the US 10-year Treasury yields to another new high since 2008 seems to undermine recent efforts by BoJ in supporting the yen’s weakness against the US dollar. The USD/JPY continues to face upward pressure, brought on by the yield differential narrative from the diverging policies’ stance between the two countries. Speculation that Japan’s authorities intervened for the second time to address yen weakness arose from the strong bearish rejection of the 151.90 level last Friday. That said, heading into the new week, it seems that losses are being aggressively pared back, as a retest of an upward trendline keeps the bullish trend in place. Therefore it seems that intervention efforts from Japan could slow the USD/JPY’s ascent at best, while hopes for a trend reversal will still heavily revolve around a pause or a pivot in US Fed’s monetary policies. Another attempt to retest the key 150.00 level could remain on the cards. Near-term support for the pair may be at the 145.90 level (level of first intervention efforts by the Japanese authorities).
 Source: TradingView
 Source: IG Charts
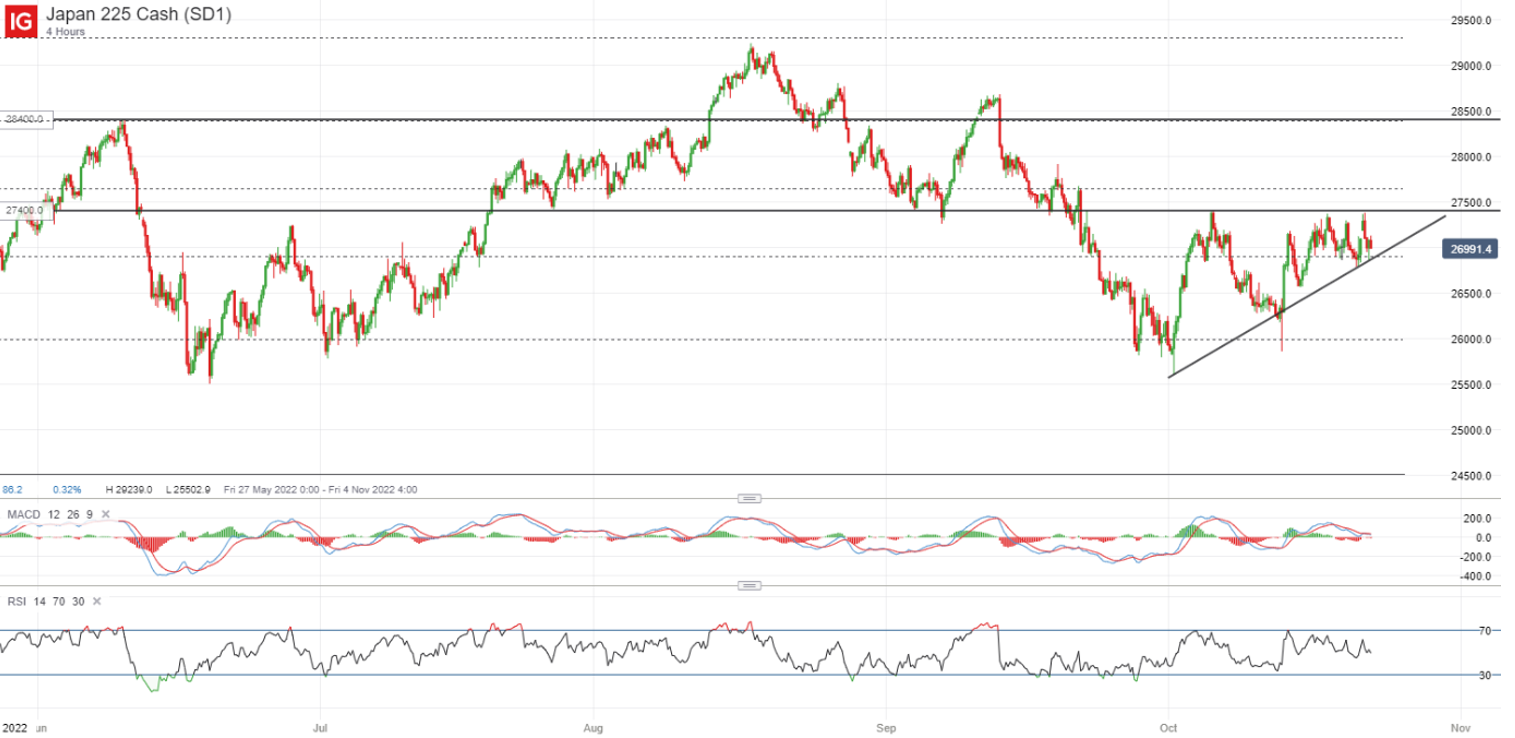
Japan 225: Seeking to overcome its 200-day moving average (MA)
A largely-expected no-change in the upcoming BoJ meeting may once again leave the Japan 225 index to take its cue from the global risk environment, with the index seeking to overcome its 200-day MA for the third occasion in less than a month. Near-term moves seem to fall within an ascending triangle pattern, with the series of higher lows suggesting an attempt by buyers to hold up for now. Much may depend on whether the upper trendline resistance at 27,400 level will be overcome this week. Any upward break could leave the 28,400 level on watch next, where a key 61.8% Fibonacci retracement stands in place.
 Source: IG Charts


0 Comments
Recommended Comments
There are no comments to display.
Create an account or sign in to comment
You need to be a member in order to leave a comment
Create an account
Sign up for a new account in our community. It's easy!
Register a new accountSign in
Already have an account? Sign in here.
Sign In Now