Uber’s share price: what to expect from Q3 results

Entry posted by MongiIG in Market News
590 views
Find out what to expect from Uber’s earnings results, how they will affect Uber share price, and how to trade Uber’s earnings.
 Source: Bloomberg
When is Uber’s results date?
Tuesday, November 1st, before the market opens, we can expect to get Uber’s results.
Uber share price: forecasts from Q3 results
And it has been consecutive misses for the past two quarters, from estimates that were already negative meaning losses that were larger than expected.
But the result wasn’t pessimistic for its share price, as its second-quarter earnings release showed a revenue beat and reported a positive cash flow for the first time in its history, sizable increases in mobility and delivery bookings as they added more drivers and delivery agents, and in all sending its share price surging at the start of August.
There was also the fact that losses then were largely due to equity investments including its Zomato stake, which it has since sold off, in line with its consistent theme of removing certain segments under its group.
From a fundamental standpoint, both Uber and more so (the less-diversified globally and as a business model) rival Lyft’s share prices were hit hard last month by the US Department of Labor’s proposed rule change that would make changes in worker classification from independent contractor to employee easier, and in turn, requires both enhanced benefits and protections should that occur.
Since then, we’ve seen a better recovery for Uber’s share price roughly the same levels pre-announcement (not just the case for Lyft’s share price), though it’s still unclear if the changes will clearly target all of their independent contractors.
There’s also the matter that we’re currently in a rate-rising environment globally that hurts valuations and more so for growth companies, and hence a change in the narrative as we approach the US Federal Open Market Committee’s policy decision and tone with which markets are expected to reprice future rate hikes will no doubt be noted within that context.
But when it comes to third-quarter results, we expect to see another loss, with earnings per share of -$0.22, and revenue of $8.13 billion. The consensus amongst analysts in September was a clear majority buy with a small minority opting for a hold, and with an average price target well above its current share price.
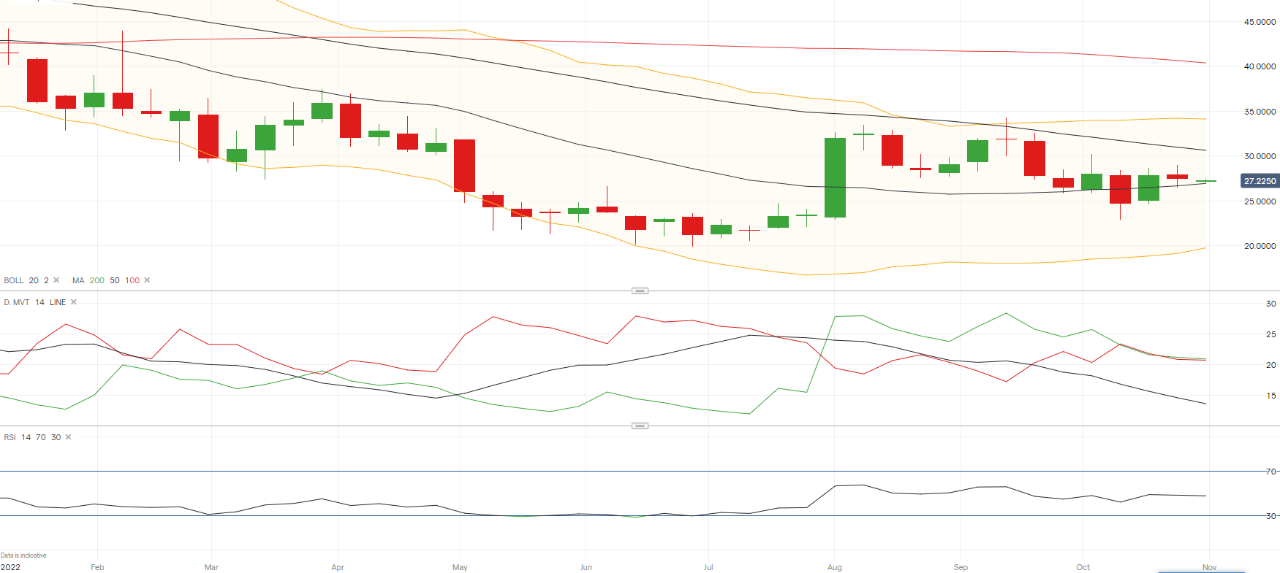
Uber weekly chart with key technical indicators (RSI, MA, DMI, Bollinger Bands)
 Source: IG
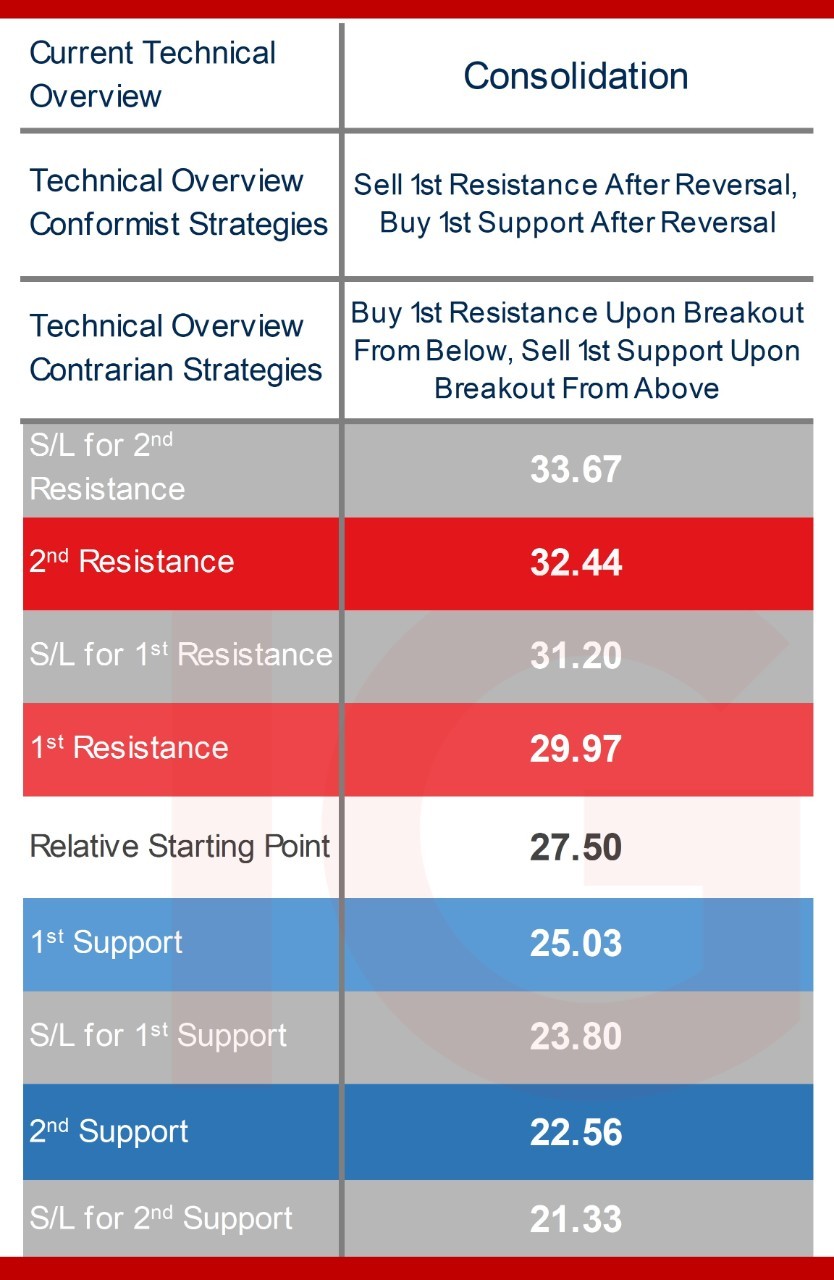
Trading Uber’s Q3 results: weekly technical overview and trading strategies
Looking at the weekly chart above and the key technical indicators are neutral to bearish. Price beneath its key moving averages (MA) is considered the negative of its overview, but otherwise within its bands, an RSI (Relative Strength Index) that’s far from oversold territory, and an ADX (Average Directional Movement Index) reading that’s fallen out of trending territory.
The August positive DMI (Directional Movement Index) cross failed to offer follow-through, as is usually the case in a bear trend or bear average scenario, though the red -DI and green +DI lines in the “D.MVT” box in the chart are close to each other and opens the door to potentially more false signals.
The daily time frame’s key technical indicators are more consolidatory following the recovery from the plummet after the labour proposal news first hit the wires, with a touch of negative technical bias as it oscillates near key technical indicators.
For the weekly time frame, the technical overview is more consolidatory after breaching its longer-term bear channel back in August, though there’s no denying the relative negative technical bias. And while that means conformists will be reversal strategies and contrarians going for breakouts, a consistent reminder that technicals hold less relevance in the face of a fundamental event, under which earnings falls under.
That means once the figures are released breakout strategies can’t be ruled out, and those opting to go opposite with a reversal ideally proceed with extreme caution and wait for a sizable break of the level first and see if prices return to key levels before initiating.
 Source: IG
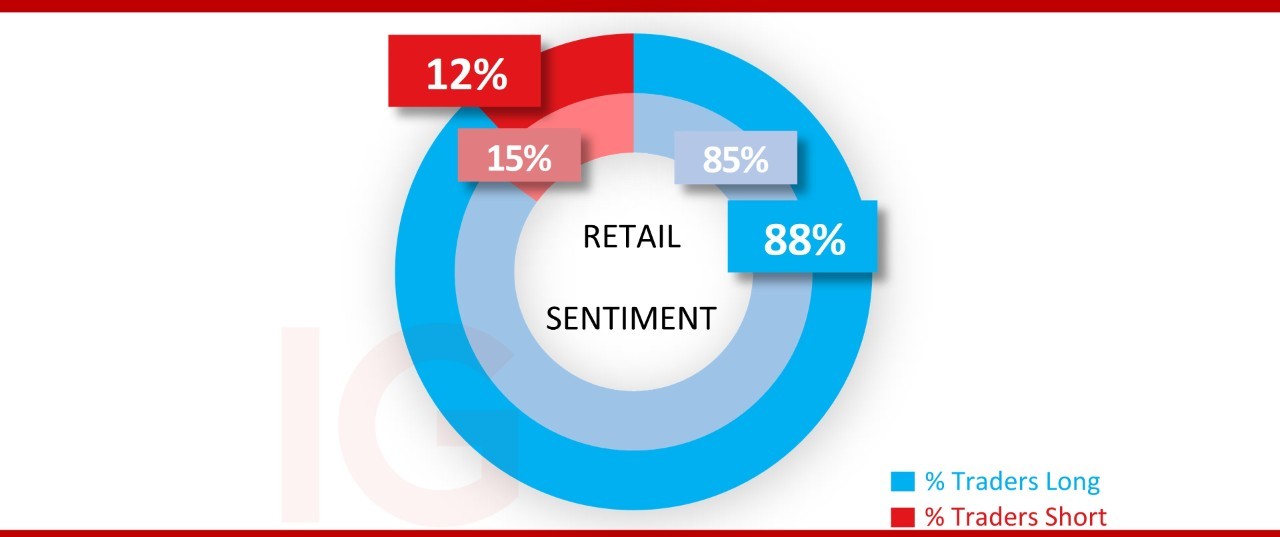
IG Client sentiment* and short interest for Uber shares
We’ve got over 61 million shares shorted as per the latest reading and represents over 3% of the 1.87 billion shares floating.
Retail trader bias hasn’t changed much and remains in extreme buy territory anticipating price gains and a recovery from these levels, at 88% from 85% a few weeks ago.
 Source: IG
*The percentage of IG client accounts with positions in this market that are currently long or short. Calculated to the nearest 1%, as of the start of the week for the outer circle. Inner circle is from October 3, 2022.


0 Comments
Recommended Comments
There are no comments to display.
Create an account or sign in to comment
You need to be a member in order to leave a comment
Create an account
Sign up for a new account in our community. It's easy!
Register a new accountSign in
Already have an account? Sign in here.
Sign In Now