US CPI data as key risk event this week: US dollar, Nikkei 225, Silver

Entry posted by MongiIG in Market News
766 views
Major US indices ended last Friday on a positive tone but remains down for the week after the Fed’s hawkish guidance drove a recalibration of rate hike expectations.
 Source: Bloomberg
Market Recap
Major US indices ended last Friday on a positive tone but remains down for the week after the Federal Reserve (Fed)’s hawkish guidance drove a recalibration of rate hike expectations. The release of the US job report saw higher-than-expected job gains in October (261,000 versus 200,000 consensus), which seems supportive for the recent Fed’s hawkish tone. Month-on-month (MoM), average hourly earnings have also moved higher to 0.4% from previous 0.3%, as a sign of ongoing wage pressures. With that, the moderation in the US labour market clearly seems far from done, but risk assets were tapping on the 0.2% uptick in unemployment rate (3.7% versus 3.5% in September) for some solace. The US dollar finds itself coming under pressure on the mixed readings, which aided to underpin the rally while US two-year yields also retraced from its initial jump. Optimism around China’s reopening may play a part as well, but some pushback by authorities over the weekend seems to question whether markets are getting ahead of themselves.
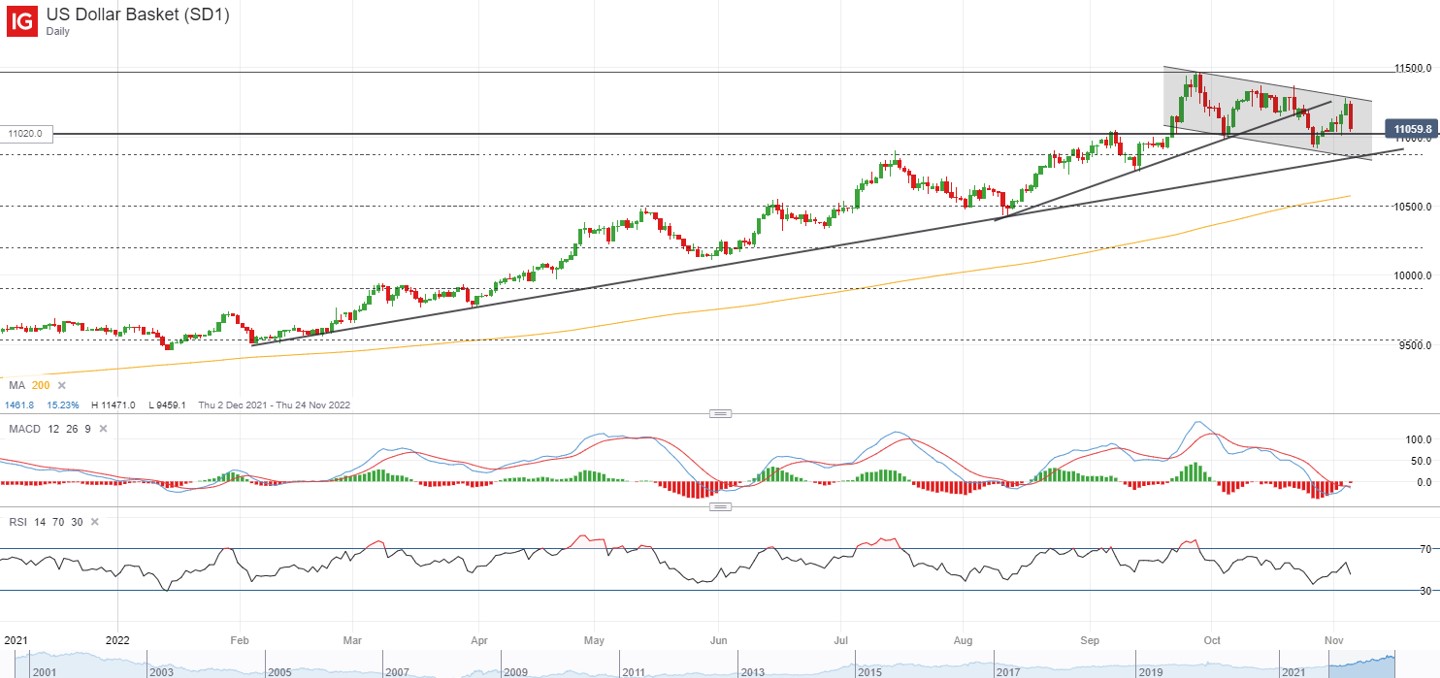
After recent strength in the US dollar index, a retest of a near-term channel trendline resistance was met with a strong bearish rejection to end last week, seeking to overturn its post-Fed meeting gains. This seems to leave the descending channel pattern intact, with further retracement potentially placing a confluence of support at the 108.50 level on watch ahead. The US two-year yields have seemingly formed a bearish shooting star, but a close below its post-Federal Open Market Committee (FOMC) meeting level at 4.60% could be warranted to provide further headwind for the US dollar.
 Source: IG charts
The week ahead will leave the US Consumer Price Index (CPI) release as the key risk event. Expectations are for both headline and core inflation readings to move lower from the previous month, but outperformance over the past months suggest that the upside risks to inflation remain present. A move below the key 8% mark for headline inflation could be catalyst for relief, but core aspects could take greater focus with recent talks of inflation being persistent. Any move below the 6.5% print for core inflation could be on watch by equity bulls.
Asia Open
Asian stocks look set for a positive open, with Nikkei +0.70%, ASX +0.39% and KOSPI +0.60% at the time of writing. The late-day swing in US indices to close in positive territory last Friday has provided a positive backdrop for the Asia session but US equities futures are pointing to some unwinding this morning. This could come partly as China’s National Health Commission dampened recent reopening hopes with a firm stick to their zero-Covid policy over the weekend. There are still positive developments on the China’s front to underpin recent sentiments, particularly with US audit of Chinese companies coming in ahead of schedule, while some rules adjustments are being made to incoming flights. But with virus cases still at its six-month high over the weekend, it seems unlikely that we will be getting significant reopening adjustments in the near term, other than just some minor tweaks at best. The day ahead will leave China’s trade balance on the economic calendar, which is likely to reinforce the muted growth picture in the country, although underperformance could see some shrugging off with hopes of reopening.
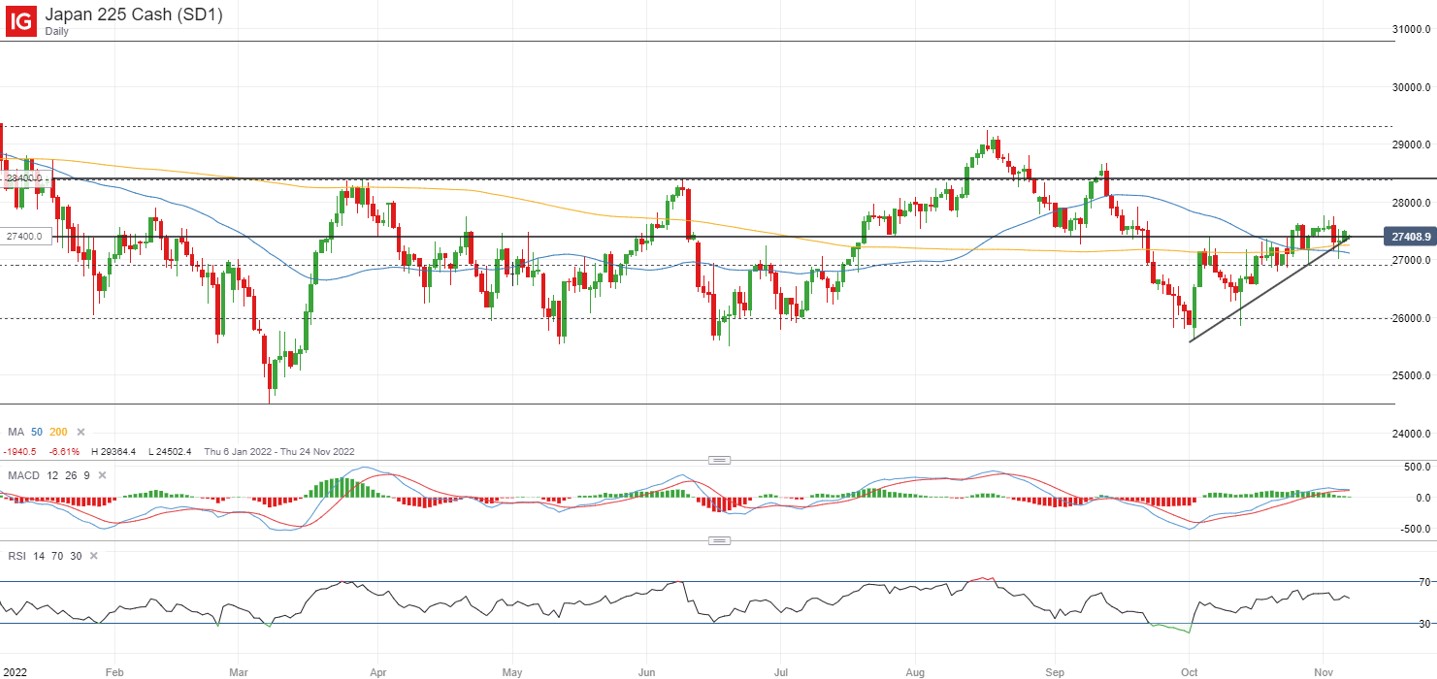
For now, the Nikkei 225 index is trading in an ascending triangle pattern, with a bullish rejection last Friday after heading below both its 50-day and 200-day moving average (MA). The higher lows continue to provide an upward bias and while recent breaks above the upper trendline resistance have stalled around the 27,600 level in recent weeks, further retest this week could increase the chances of overcoming it. All eyes will revolve around the key US CPI data to provide the go-ahead.
 Source: IG charts
On the watchlist: Silver prices attempting a break of upper bound resistance of ranging pattern
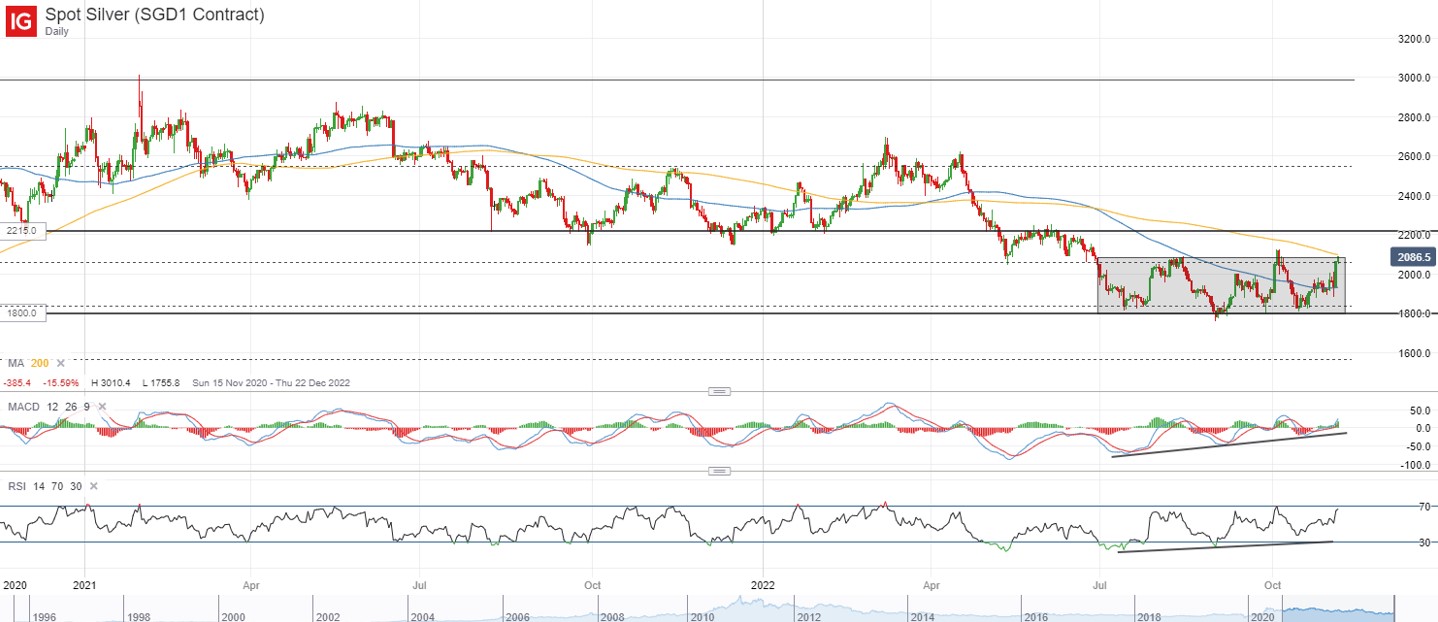
A sharp retracement in the US dollar last Friday has propelled silver prices to the US$21.00 level, along with speculations of China’s economic reopening aiding to underpin prices for the industrial metal last week. Having largely traded within a ranging pattern since July this year, recent upside is bringing a retest of the upper bound resistance, in coincidence with its 200-day MA. Further weakness in the US dollar will be on watch to provide the go-ahead for silver prices’ upside, with a break above the US$21.00 level potentially leaving the US$22.15 level on the radar next. Failure to do so, however, could leave the ranging pattern in place and a retracement could leave the US$19.30 level as near-term support.
 Source: IG charts
Friday: DJIA +1.26%; S&P 500 +1.36%; Nasdaq +1.28%, DAX +2.51%, FTSE +2.03%


0 Comments
Recommended Comments
There are no comments to display.
Create an account or sign in to comment
You need to be a member in order to leave a comment
Create an account
Sign up for a new account in our community. It's easy!
Register a new accountSign in
Already have an account? Sign in here.
Sign In Now