Natural gas prices jump 8% as inflation fears resurface

Entry posted by MongiIG in Market News
339 views
Natural gas gaps higher, with prices looking set for further upside
 Source: Bloomberg
Natural gas futures signal sharp resurgence after protracted pullback
Energy markets have been on the back foot over the course of recent months, with US Natural Gas prices losing 46% in the two-months since the August high. While easing concerns around the potential for a cold European winter brought downside for price in October, we are seeing those fears resurface again as weather forecasts signal a colder-than-normal December in Northwest Europe. We have also seen questions arise over the European ability to fill their tanks next year in absence of all Russian imports. Thus far Europe has been very successful at filling the tanks ahead of this Winter. However, the IEA have speculated that lower supply from Russia, and higher Chinese LNG demand will provide a massive shortfall ahead of next winter. In the IEA’s worlds, “Europe could face a 30 bcm shortfall in the gas it needs to fuel its economy and sufficiently refill storage sites during the summer of 2023, jeopardising its preparations for the winter of 2023-2024.” 30 bcm represents a shortfall of roughly half the gas needed to fill the storage facilities to 95% by the beginning of the 2003/04 heating season. While this may have longer-term implications, it does highlight the likeliness that Europe will be hoovering up gas over the course of the year to avoid a crisis next winter.
 Source: IEA
US unlikely to help as Biden reiterates stance
Gas has kicked off the week in style today, with prices over 8% higher in early trade. While US gas has seen significantly less volatility compared with Europe, the global nature of the European hunt for LNG means that we will continue to see US prices impacted by shifts in the foreign demand outlook. Meanwhile, Joe Biden has drawn a line under the exploration picture in the US, with his declaration that there will be no more drilling under his Presidency signalling an unwillingness to dampen inflation by supporting further exploration. Given that we are talking about the world’s biggest producer of oil and gas, this stance will make things more difficult for Europe. After-all, the second, third, and fourth biggest gas producing nations are Russia, Iran, and China. Hardly a whose who of countries seeking to help alleviate a European crisis.
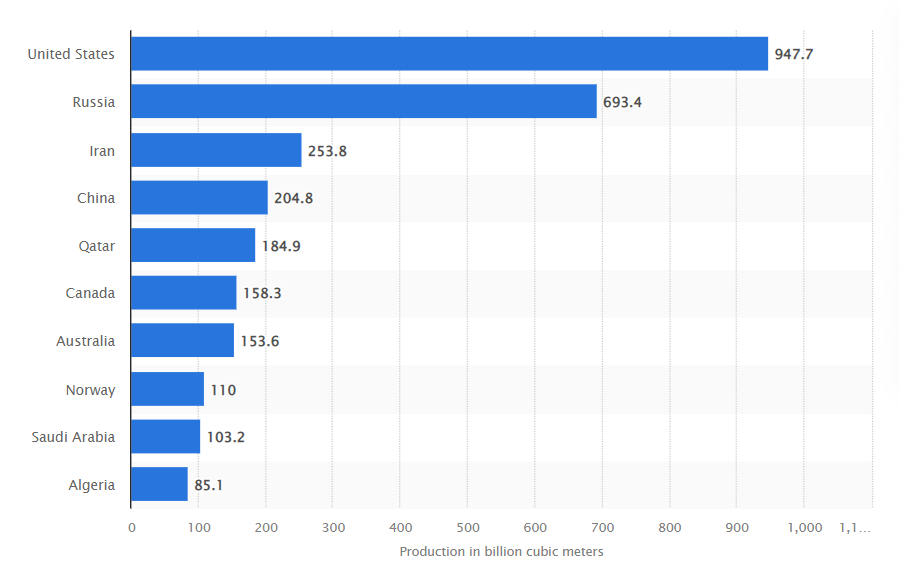 Source: Statista
It is worthwhile noting that the US production does continue to trend upwards, with output expected to remain above average levels. Despite Biden’s approach, it does seem like the elevated prices have helped provide strong production levels irrespective. Nonetheless, it is still going to be worthwhile to note any changes in tone from the President as a driver of market sentiment.
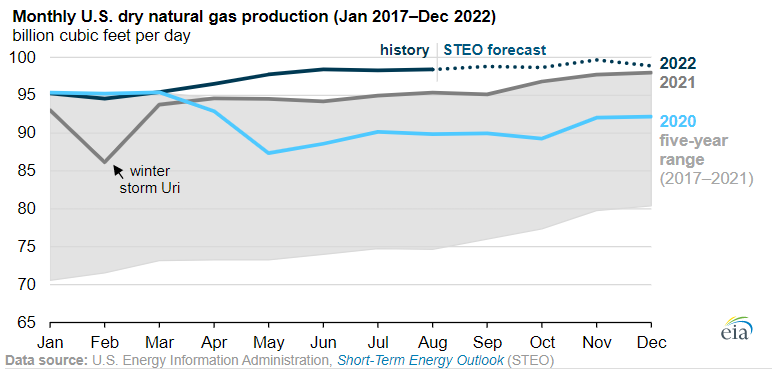 Source: EIA
Natural gas technical analysis
From a long-term perspective, we can see how the recent recovery in Natural Gas prices has come from channel support, with the wider uptrend remaining in place despite recent declines. The stochastic is turning upwards from oversold territory, with the indicator pushing out over oversold territory for the fourth time this year. Those three previous occasions have provided us with very timely buy signals, which could be the case once again here. We are also seeing the MACD histogram rolling upwards in a manner that also mimics the moves seen in January and July.
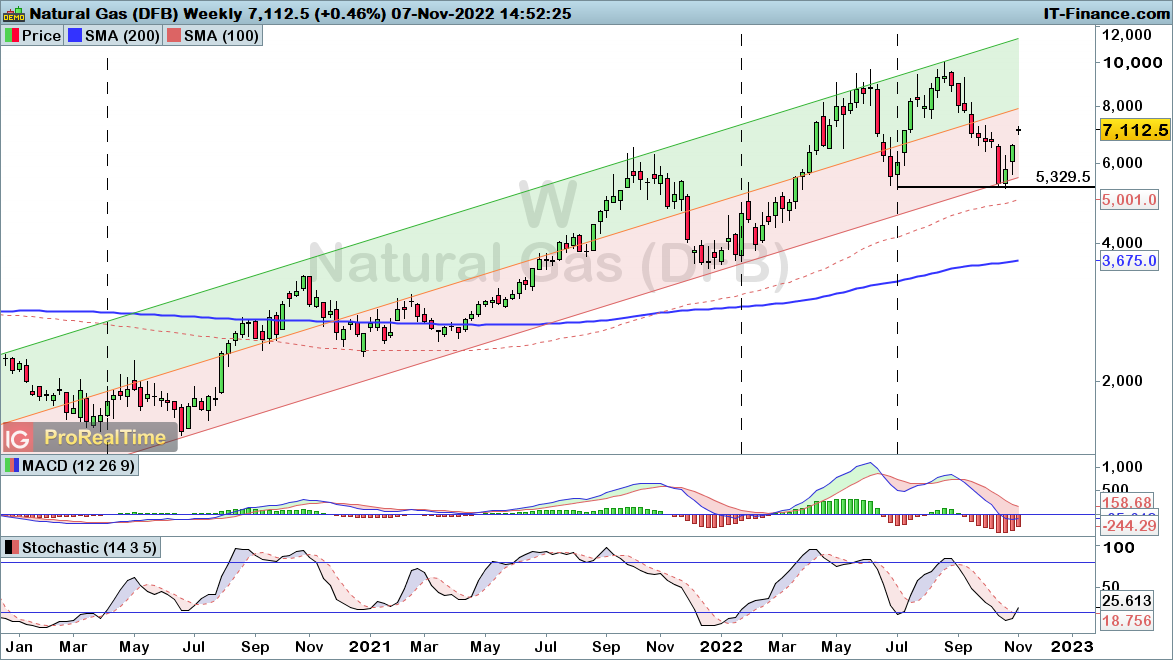 Source: ProRealTime
The daily chart highlights how prices are moving sharply higher over the course of the past fortnight, with price rising 34% since the late-October low. Notably, that rebound has taken place from the July low of $5.329. That recovery has taken us up into the $7.261 resistance level, which is the first swing-high established in late-October. A break through this point signals expectations of further upside, with significant consequences for wider market sentiment given the implications for inflation, monetary policy, and household/business expenses.
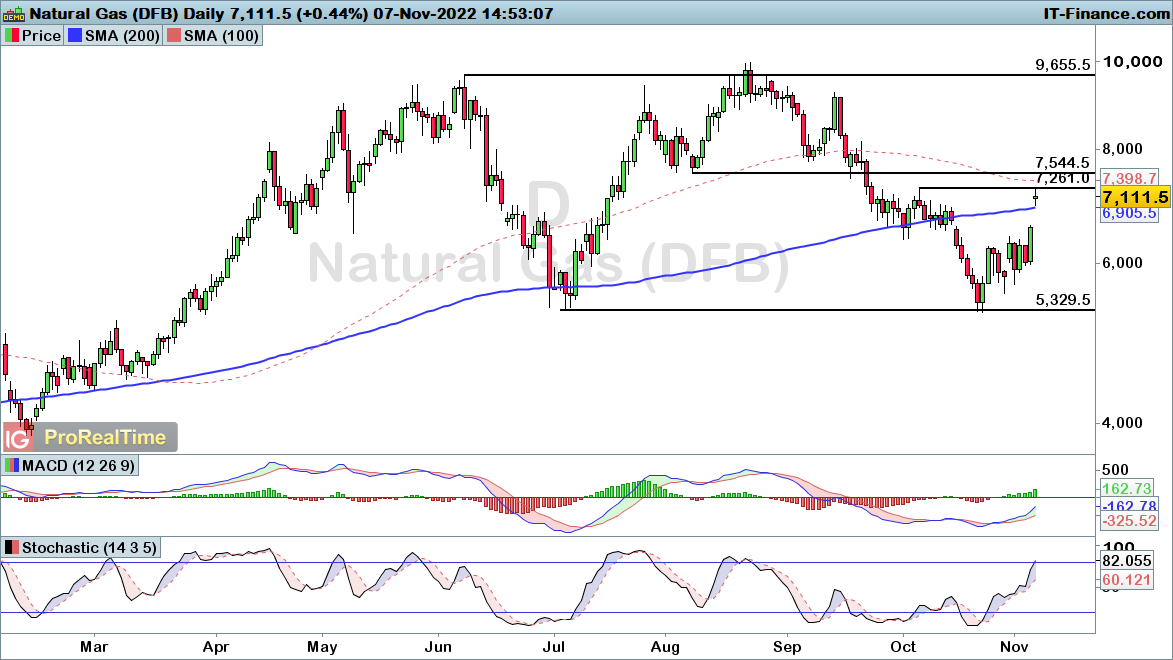 Source: ProRealTime


.jpeg.98f0cfe51803b4af23bc6b06b29ba6ff.jpeg)

0 Comments
Recommended Comments
There are no comments to display.
Create an account or sign in to comment
You need to be a member in order to leave a comment
Create an account
Sign up for a new account in our community. It's easy!
Register a new accountSign in
Already have an account? Sign in here.
Sign In Now