FTSE 100: has the equity bear market come to an end?

Entry posted by MongiIG in Market News
613 views
Outlook on the FTSE 100 and FTSE 250 into year-end and for 2023 within the context of falling US Consumer Price Inflation and 41-year high inflation in the UK.
 Source: Bloomberg
US lower-than-expected inflation print reinforces global equity bear market rally
Last week saw a weaker-than-expected print in the October US Consumer Price Inflation (CPI) data which came in at 7.7% (not seasonally adjusted) versus an expected 8.1%, prompting a strong rally in global equity markets amid positive sentiment.
With the FTSE 100 having risen by around 10% from its October trough to now only trading around 1.5% below its February peak at 7,672, investors may be wondering whether the global equity bear market has ended.
Strictly speaking the FTSE 100 has actually not been in a bear market (yet) as the widely used definition for an equity bear market is a fall of more than 20%. Since the FTSE 100 has dropped by less than 13% peak-to-trough, it doesn’t qualify as a bear market.
What about the FTSE 250 and other global equity indices?
With its January-to-October 2022 decline of more than 30%, the FTSE 250 certainly qualifies as a bear market, just as other European (DAX 40 at -27%), Asian (Hang Seng at -44%) and US (S&P 500 at -27%) equity markets.
With most global equity indices having so far risen by between 10% and 20% in the past month, the question is whether the current rally is likely to continue and whether the low of this year’s bear market has been seen.
More than a short-term rebound?
Hopes of a slowdown in inflation in the US, leading to a potential slowing of the rate of interest rate increases, have not yet been replicated in the UK where the year-on-year Consumer Price Inflation (CPI) for October came in at a stronger-than-expected 11.1%, the highest reading since October 1981, versus a forecast 10.7% and 10.1% in September.
Core CPI (excluding price changes in food and energy) hit 6.5% versus an expected 6.4% and the Retail Price Index (RPI) rose to 14.2% versus an expected 13.6% and 12.6% in September.
Nonetheless the FTSE 100 remained on an upward trajectory, albeit accompanied by a slowdown of upward momentum, while the FTSE 250 and European equity indices mostly declined.
 Source: ProRealTime
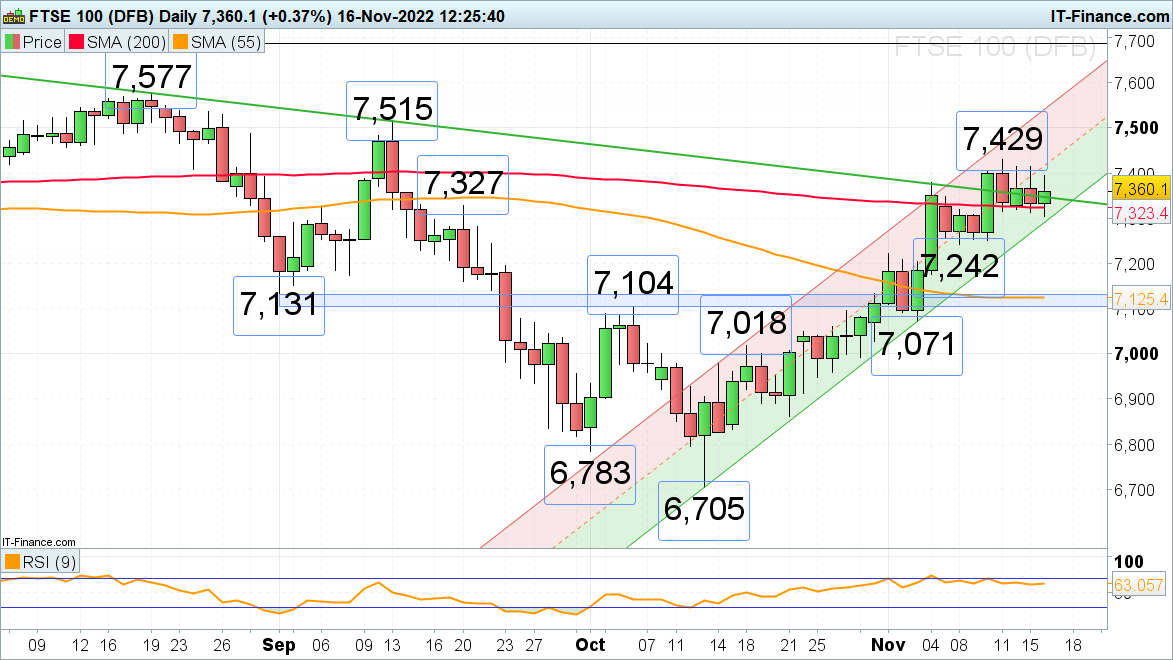
Since the FTSE 100’s advance to above the 7,400 mark has not been accompanied by an equally higher reading in the daily Relative Strength Index (RSI), negative divergence can be spotted on the daily chart and thus a short-term retracement lower is likely to soon be encountered.
While the 7,131 to 7,104 support area, made up of the August low, early October high and 55-day simple moving average (SMA), underpins, and the early November low at 7,071 isn’t being slipped through on a daily chart closing basis, further upside into year-end is likely to ensue, making the current rally more than just another short-term bounce and turning it into a proper bear market rally.
The same is true for several other global indices in that as long as they remain above their respective support areas, often made up of the September and/or early November lows as well as the October highs, further upside into year-end may well unfold.
Historically speaking equity markets tend to rally at some stage during the month of December, helped by US 401k retirement plan inflows into equities towards the end of the year.
First, though, at least a short-term retracement lower seems to be on the cards with several global equity indices having reached their 200-day simple moving averages (SMA) which act as resistance and have, as is the case for the FTSE 250, provoked a short-term sell-off.
 Source: ProRealTime
Have we seen the end of the 2022 bear market?
Just as the US Federal Reserve (Fed) Governor Christopher Waller warned investors against getting too optimistic over one inflation report, it has to be seen whether the recent decline in US inflation is indeed the beginning of a downward trend and how the Fed is going to adjust its monetary policy accordingly.
For instance, Waller also said that the US Federal Reserve “still got ways to go” with interest rate hikes whilst acknowledging that the Fed may slow the pace of rate increases in the coming meetings.
The Fed’s commitment to reduce US inflation back to its 2% target, something which in the past has taken on average around five years, highlights the risk of a significant contraction in the economy over the coming quarters which would then most likely drive down equity prices once more, and probably to below this year’s lows.
Furthermore, stock allocation at the recent equity indices lows in October were relatively high at over 60% and cash allocations quite low at below 25% when compared to previous bear market lows when the former was closer to the 40% mark and the latter, cash allocation, shot up as high as 40% in investment portfolios, the exception being the rapid Covid crash with an around 55% stock allocation.
The data suggest that we haven’t seen any capitulation in financial markets which usually accompanies bear market bottoms. With the majority of major economies around the world either being close to or technically in a recession, another rout in stock market performance may be witnessed next year, especially if earnings begin to disappoint.


.jpeg.98f0cfe51803b4af23bc6b06b29ba6ff.jpeg)


0 Comments
Recommended Comments
There are no comments to display.
Create an account or sign in to comment
You need to be a member in order to leave a comment
Create an account
Sign up for a new account in our community. It's easy!
Register a new accountSign in
Already have an account? Sign in here.
Sign In Now