ASX outlook: What to expect in 2023?

Entry posted by MongiIG in Market News
460 views
With the year coming to a close and a new chapter just around the corner, let’s take one more look at the journey travelled and see what we can expect for the 2023.
 Source: Bloomberg
ASX in 2022
2022 has been an unpleasant year of decades-high inflation and non-stop rate hikes.
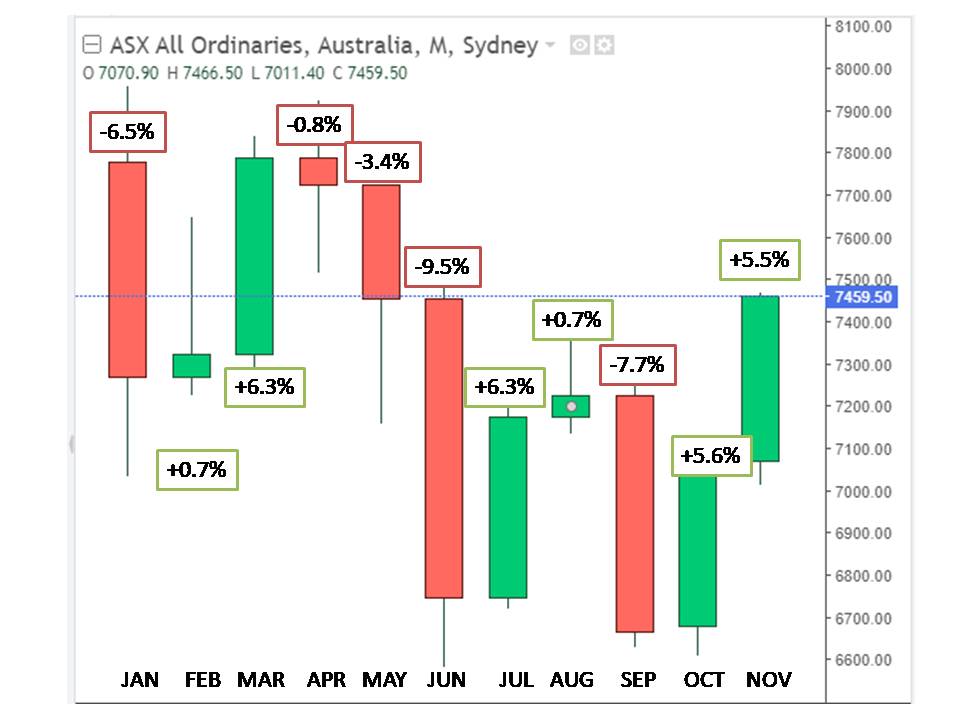
With no exception to the previous rate-rising periods, Australia’s stock market has gone through a turbulent time. In June, the benchmark index tumbled into the correction zone for the first time in two years, which is defined by a 10% drop from the recent peak.
Nevertheless, the benchmark index still enjoyed monthly gains for the majority of the time (refer to the monthly chart below). By the end of November, the index has pared more than half of the loss and sat only 3% below the level where the year started.
 Data source: Investing.com, edit by IG
The primary drivers throughout the year were the rapid change in global monetary policies and the cloudy economic outlook. Since May, the Reserve Bank of Australia has delivered 275 basis points of rate hikes, including a record consecutive run of four 50 basis-point increases, taking borrowing costs to a level not seen since April 2013. The tightening journey that Australian people have experienced this year is the fastest pace since 1994.
In addition to the macro themes mentioned, soaring costs, floods in Eastern Australia, multiple Covid-19 waves, supply-chain challenges, labour shortage and housing cycle fluctuations continue to weigh on the ASX investor’s confidence over the local economy.
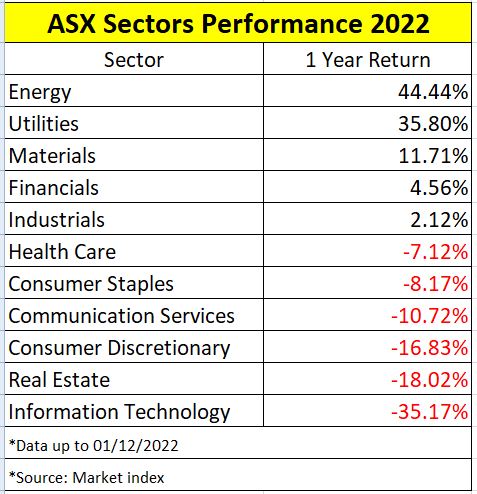
As such, the performance of each ASX sector varied widely. Energy, utilities and material sectors have benefitted the most from robust demand and higher price as the Ukraine war boosted the demand for Australian exports. Mining companies, in particular, are seeing their earnings and profits rising to a record level. On the other hand, the information and real estate sector are the first-row victims hammered by the higher interest rates.
 Source: Market Index
ASX 2023 Outlook
Looking ahead, it is foreseeable that the headwinds and issues dominated over the past six months will continue to be concerns for investors.
The rising inflation, despite an early sign of cooling starting to surface, is still a long distance away from the ideal territory. Australia’s consumer prices index increased 7.3% in the third quarter and is expected to peak at around 8% by the end of 2022, based on RBA’s recent forecast.
With that in mind, there’s no doubt that the interest rate will continue rising towards and potentially surpass the decade-high level. Based on the future market’s prediction, the third quarter of 2023 will see the interest peak at around 3.8%.
 Source: ASX
However, the months ahead in the new calendar will also have the opportunity to see the inception point finally arrived for the local monetary policy. Even with the absence of the first rate-cut to occur, the pause of the current tightening journey is likely to reignite the risk appetite for Australian equities.
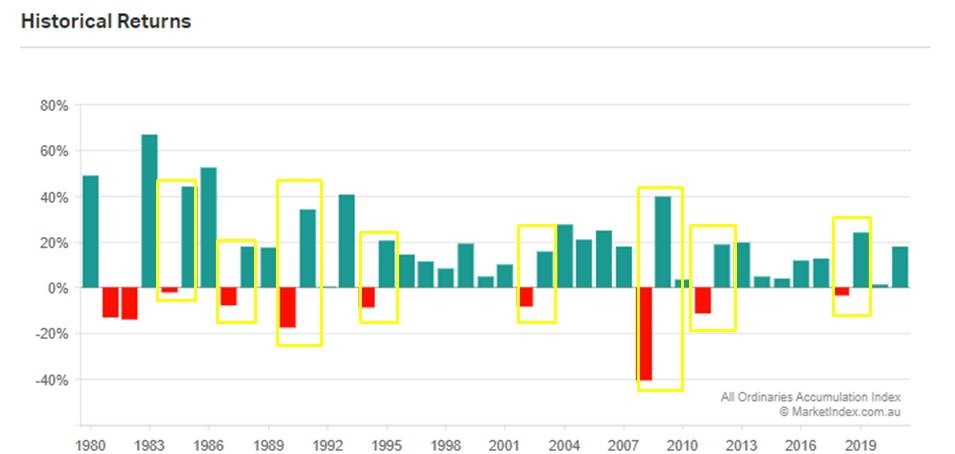
During the past 40 years, the Australian share market has shown a strong pattern of outperforming with a double-digit rebound following a year of decline. The only exception was during the recession in 1982-1983, but the stock market then made a record 60% jump in the following year.
 Source: Marketindex
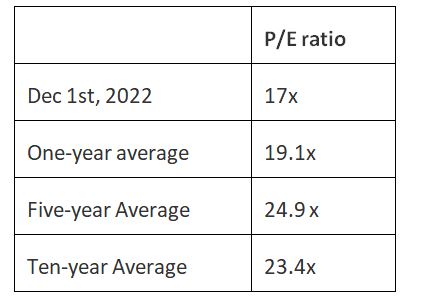
Besides the change of monetary policies, the attractive valuation is another source of tailwind for 2023. The Aussie sharemarket’s valuation has become much more appealing today compared to a year ago, with the Price/Earnings (P/E) ratio is now below the five and ten-year average.
 DATA SOURCE: HTTPS://SIMPLYWALL.ST/MARKETS/AU
Summary
Overall, it’s foreseeable that the year and months ahead will have no shortage of challenges and headwinds. However, with the potential slowdown in monetary tightening and the cooling of inflation, some of the forces that have been dragging on shares in 2022 have good chance to be ease and generate investment opportunities.


0 Comments
Recommended Comments
There are no comments to display.
Create an account or sign in to comment
You need to be a member in order to leave a comment
Create an account
Sign up for a new account in our community. It's easy!
Register a new accountSign in
Already have an account? Sign in here.
Sign In Now