Could the VIX be signalling the beginning of the next equity market collapse?

Entry posted by MongiIG in Market News
1,059 views
The VIX has reached a critical support level, with the S&P 500 and other equity markets looking at risk of another bearish reversal
 Source: Bloomberg
VIX reaches historical support zone
The VIX has been hit hard over the course of the past two-months, with this week currently on track to end a run that has seen eight consecutive weekly declines for the volatility index. This has taken price down into a highly significant zone of support, which underpinned the index over the course of the past 10-months. That decline came as a result of improved market sentiment, which sent the S&P 500 into a two-month high. The chart below highlights how the main European and US indices have fared over the course of this year, with the latest rally providing varying degrees of recoveries in relation to previous declines. The likes of the FTSE 100, Dow, and DAX have all managed to push up through their August highs, while the Nasdaq and S&P 500 continue to trade well below their respective peaks.
 Source: TradingView
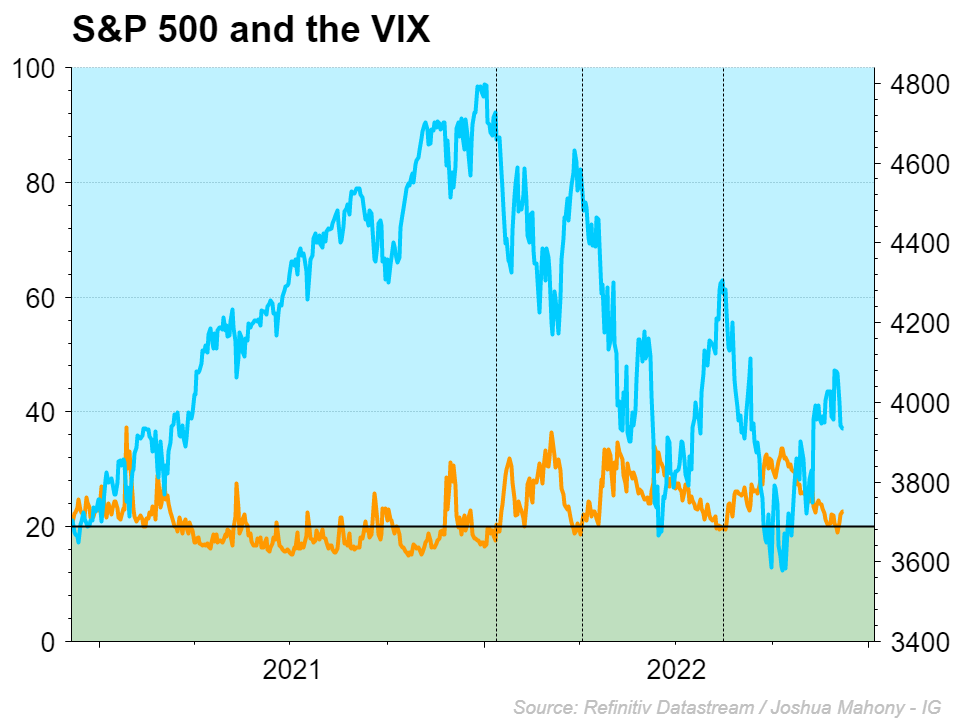
VIX reaches historical support zone
Looking at the relationship between the S&P 500 and the VIX, we can see that the past year has provided a remarkably consistent correlation between the two. With the VIX commonly regarded as the ‘fear gauge’, it should come as no surprise to see an inverse correlation that sees the VIX rise as markets head lower. Interestingly, we can see that the VIX has provided us with very timely signals over the course of 2022 thus far, with each pullback into the 20 level bringing a market top once the VIX breaks up through that threshold once again. It is important to note that this push back up through the 20 threshold provides an initial signal that momentum is turning in favour of the VIX bulls. Given how extended this equity rebound has become in the face of growing economic risks, there is a good chance that this 20 reading on the VIX could signal the potential for a fresh risk-off move taking shape here.
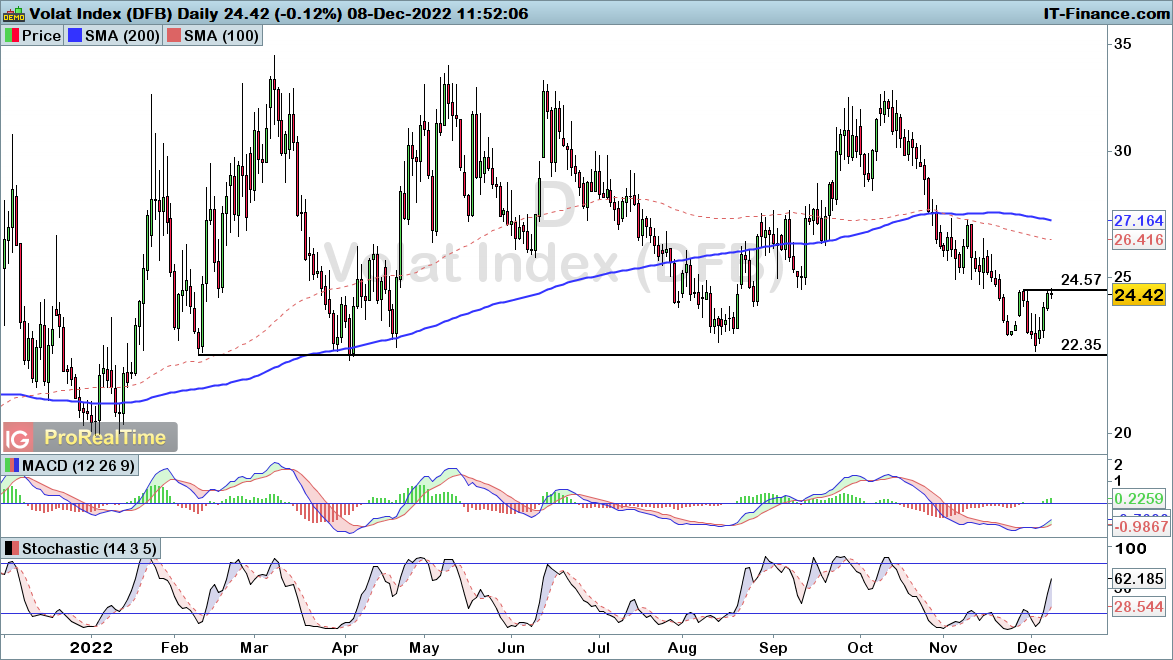
VIX technical analysis
Looking at the daily VIX chart, we can see that the recent push higher has taken price up into the key 24.57 resistance level. That brings an end to the trend of lower highs, signalling the potential for another bottom here. Given that this occurs around that same support level that has held on three occasions already this year, VIX bulls will likely be emboldened by this latest rise into 24.57 resistance. Nonetheless, there is always a good chance that we see a short-term pullback as bulls and bears battle it out over whether this is simply a continuation retracement or the start of a new directional phase. A push through this resistance level would therefore give us greater confidence that the downtrend is over.
 Source: ProRealTime
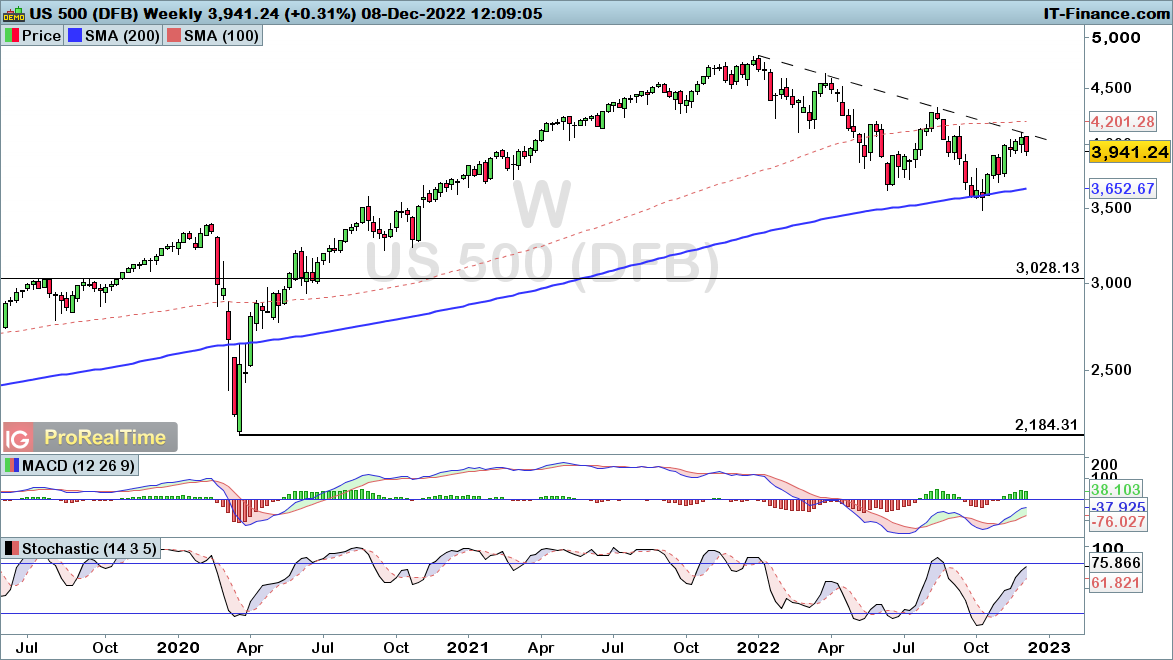
S&P 500 technical analysis
Let’s take a look at the S&P 500. The recovery phase exhibited over the course of the past two-months has brought us back into a descending trendline that has capped each rally seen this year. This week has seen the bears come back into play once again, with price currently on track to post a bearish engulfing formation. With that in mind, the latest rebound in the VIX and likely bearish engulfing signal on the S&P 500 do raise significant concerns that we could be on the cusp of the next leg lower for equity markets.
 Source: ProRealTime
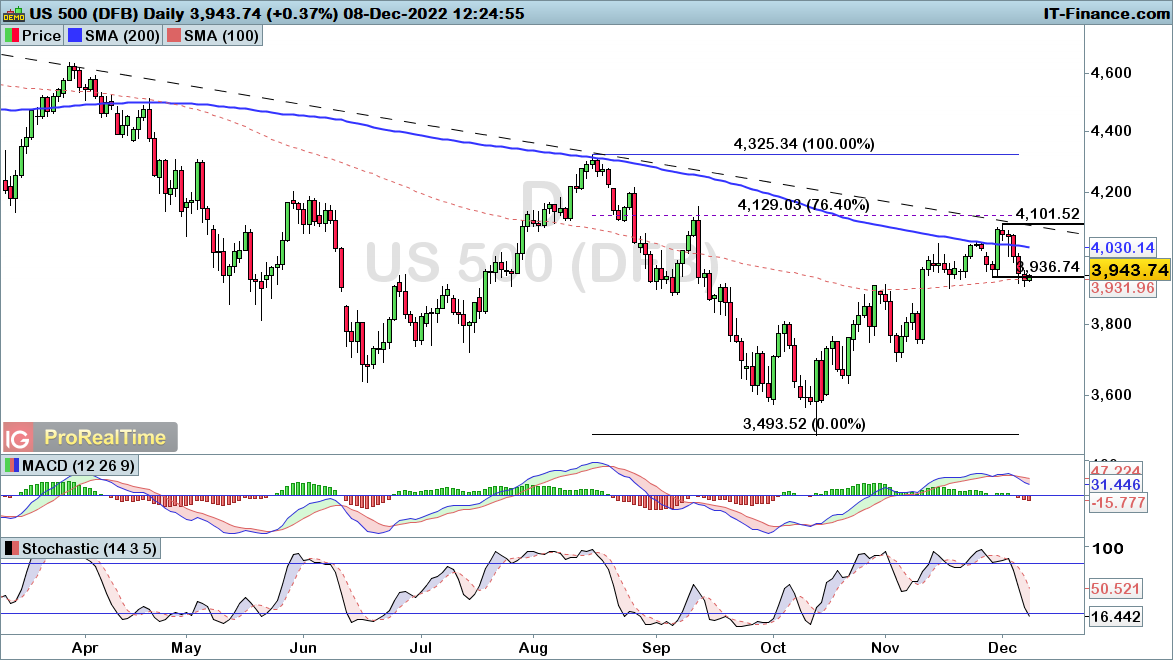
From a daily perspective, the short-term uptrend has broken after seeing price fall down through the 3936 swing-low. That brings greater confidence that the bears will come back into play after this rise into the trendline and Fibonacci resistance zone. With that in mind, a bearish reversal is growing in likeliness, but a near-term rebound could take hold as the bears attempt to wrestle control. As such, any near-term rebound could represent a selling opportunity, with a move up through the recent peak of 4101 required to bring the bullish trend back into play.
 Source: ProRealTime


0 Comments
Recommended Comments
There are no comments to display.
Create an account or sign in to comment
You need to be a member in order to leave a comment
Create an account
Sign up for a new account in our community. It's easy!
Register a new accountSign in
Already have an account? Sign in here.
Sign In Now