Bank of Japan (BoJ) preview: Speculations brewing for further policy changes following December’s surprise tweak

Entry posted by MongiIG in Market News
909 views
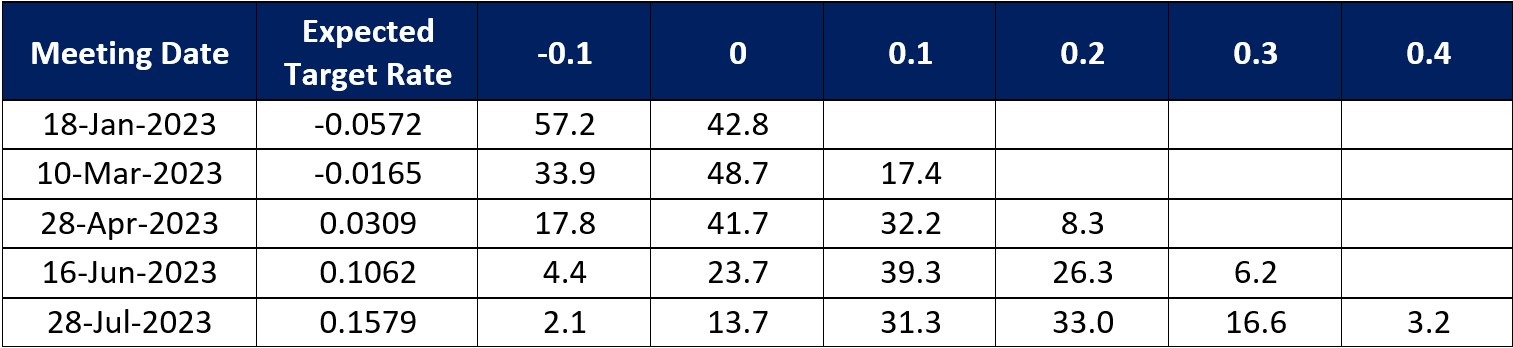
The BoJ is set to hold their monetary meeting across 17 – 18 January 2023, with some market participants wagering on further policy shifts, following the December's tweak to its yield control policy.
 Source: Bloomberg
What to expect at the upcoming Bank of Japan (BoJ) meeting?
The BoJ has stunned markets less than a month ago with its decision to widen the band around its 10-year yield target to 0.5% from previous 0.25%, with the surprise move triggering a ‘more hawkish’ repricing of market rate hike expectations in its aftermath. Heading into the upcoming meeting, expectations remain firm that a step higher in short-term interest rate from the central bank could come in either March or April later this year, largely perceived to be setting the groundwork for an impending policy shift when the new BoJ governor takes over.
 Source: Refinitiv
Over the past few days, speculations have also been brewing for further policy tweaks, which saw the BoJ having to step in with a record amount of bond-buying operations last Friday after the benchmark 10-year bond yield cap was breached (it climbed to as high as 0.54%). While the BoJ Governor Haruhiko Kuroda continues to push back against a near-term exit from its ultra-loose monetary policy, the credibility of the central bank has been somewhat damaged ever since its previous bombshell, which may dilute the effectiveness of its forward guidance. This could drive more measured market responses to the central bank’s guidance, with rising doubts that the BoJ’s accommodative policies will be able to stay for longer, especially if the upcoming quarterly outlook report continues to reveal an upward revision to its inflation forecasts. An end to its yield curve control (YCC) policy seems to be perceived as a matter of when, not if.
At the upcoming meeting, any inaction or wait-and-see from policymakers could still be possible, considering that another tweak within such a short period of time could further damage the central bank’s credibility. Policymakers may also push back against inflation persistence for now, hoping to seek more evidence of stronger wage growth to be comfortable with stepping away from its current easing stance. That said, market participants are now on high-alert mode, and any optimism around stronger wage guidance, better economic recovery or a shift in central bank’s tone could be tapped on to justify expectations of an impending dial-back in the BoJ’s policies.
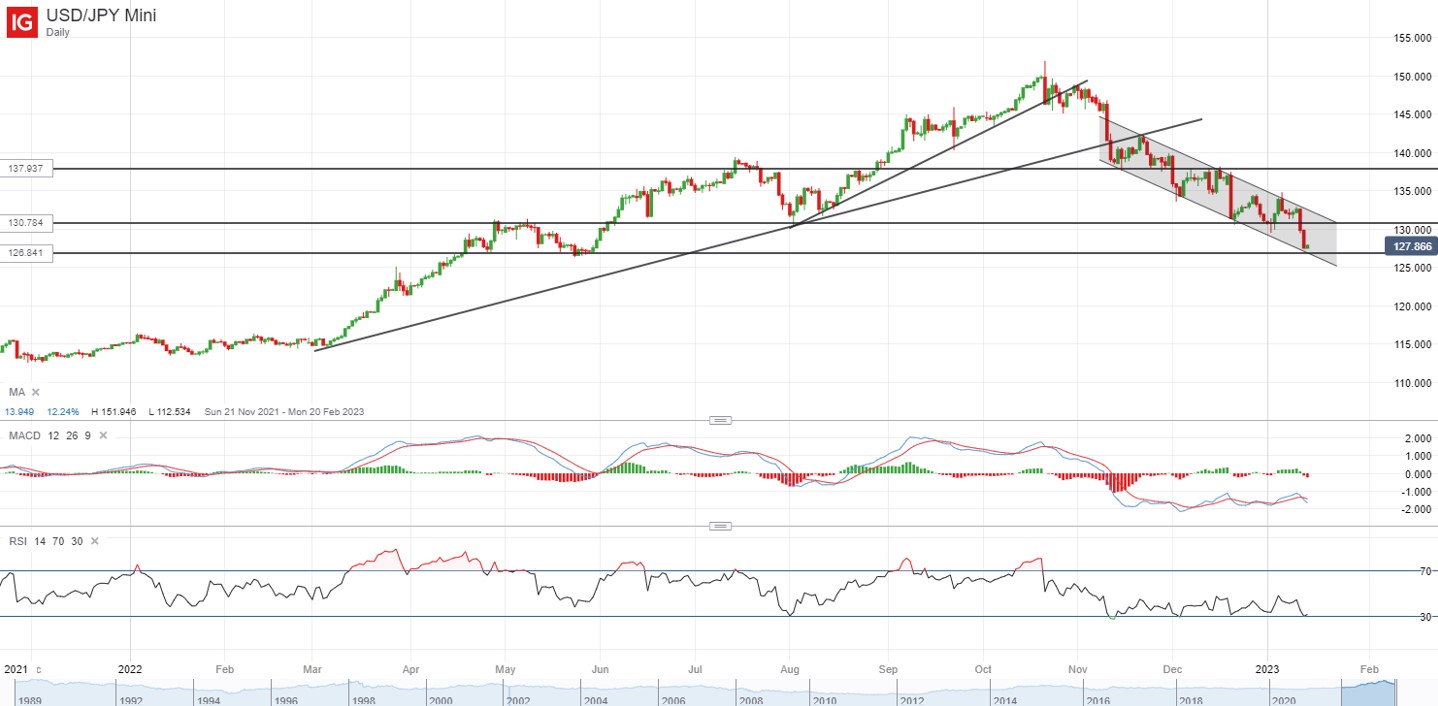
USD/JPY: Descending channel pattern remains intact
The USD/JPY has been guided firmly by a descending channel pattern since mid-November last year, with the lower highs and lower lows presenting an ongoing downward trend. A break below its 200-day moving average (MA) last month continues to see the pair heading lower, with attempts to recover thus far relatively short-lived. Trading within the channel pattern will leave the 126.84 level in focus as potential support in the near term, although any bounce could leave the upper channel resistance at the 130.80 level on watch for the formation of a lower high. Commodity Futures Trading Commission (CFTC) data revealed that speculative traders have been cutting back on their yen shorts over the past two months, but remained in overall net-short positioning (-35.4k) as of last week, which suggests room for further shorts-covering.
 Source: IG charts
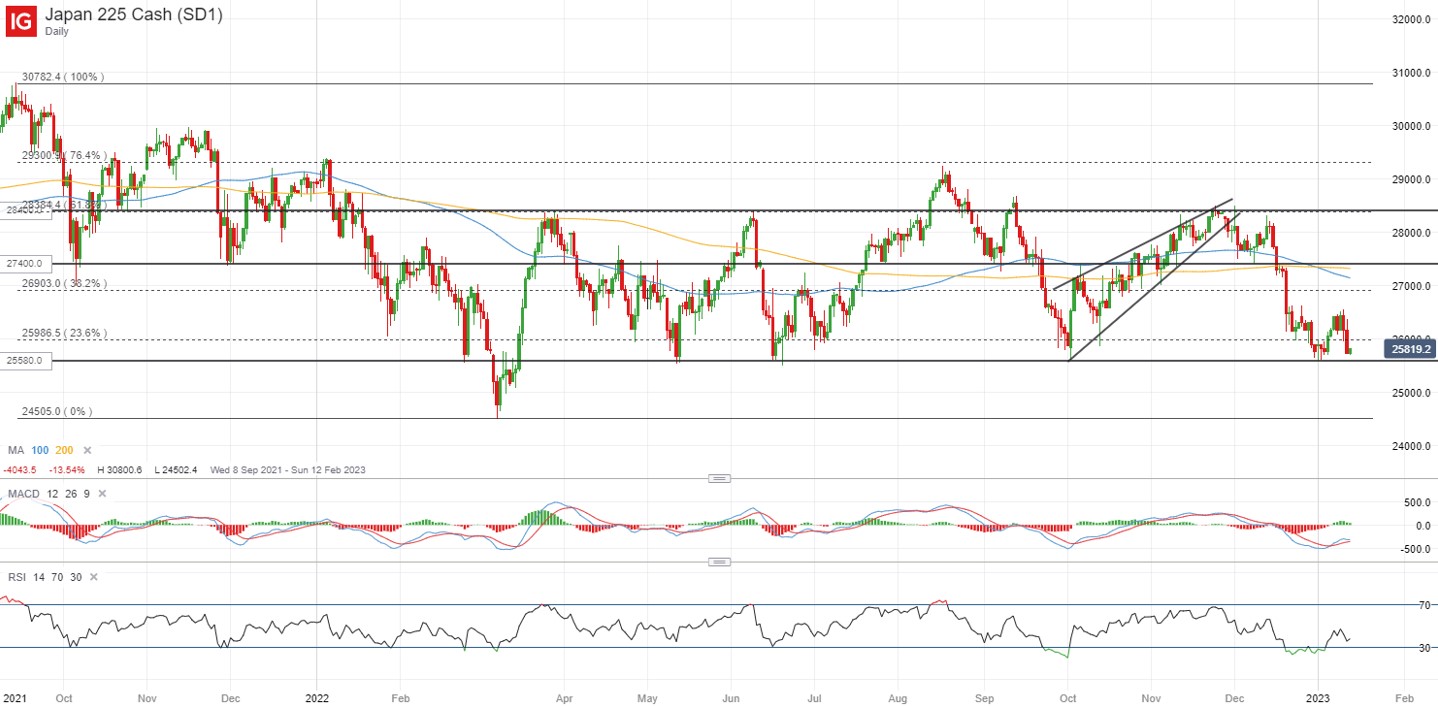
Nikkei 225: Remained under pressure ever since YCC policy tweak
The BoJ’s tweak to allow a higher risk-free rate (0.5%) in the 10-year Japan Government Bonds (JGBs) has translated to downward pressure for equities, with the Nikkei 225 index retracing by more than 8% ever since the last BoJ meeting. While the index is nearing a key horizontal support at the 25,580 level, a previous attempt to bounce off this level at the start of the year has failed to sustain. Breaking below the 25,580 level could be on watch to potentially pave the way towards the 24,500 level next, which marks its two-year low.
 Source: IG charts


0 Comments
Recommended Comments
There are no comments to display.
Create an account or sign in to comment
You need to be a member in order to leave a comment
Create an account
Sign up for a new account in our community. It's easy!
Register a new accountSign in
Already have an account? Sign in here.
Sign In Now