Where to next for the FTSE 100 as it nears its all-time high?
Can the FTSE 100 replicate its 2022 outperformance while getting ever closer to its May 2018 record high?
 Source: Bloomberg
The UK blue chip FTSE 100 index is on track to make a new all-time high above its May 2018 peak at 7877.45 and may do so within days, having spent the past two decades since the year 2000 in a wide sideways trading range and having greatly underperformed most of its peers.
Is this about to change?
Well, during 2022 the FTSE 100 for once outperformed its European and US counterparts and was the only major G7 index to have ended the year in positive territory after a boom in commodity, mining and energy company profits boosted its constituent stocks.
With energy stocks making up around 9.5% of the UK index’s composition and these, such as BP, for example, having risen by around 50% in 2022, commodities stocks accounting for 13.39% and mining stocks such as Rio Tinto benefitting from high inflation and their share prices on average rallying by over 30%, no wonder the FTSE 100 outperformed its peers last year.
Is the FTSE 100 2022 outperformance likely to continue during 2023?
With inflation coming off its peak and energy prices normalizing to a certain extent, oil trading at similar levels compared to the end of December while US natural gas futures slid by over 10% in the past couple of weeks, further FTSE 100 outperformance, at least short-term, seems unlikely.
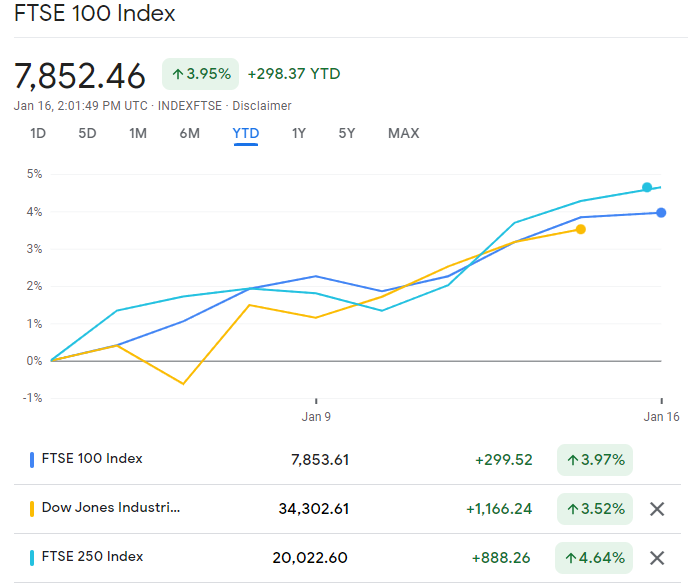
Even though the FTSE 100 kicked off 2023 on a strong footing with a year-to-date performance of around 4%, it nonetheless underperformed US indices such as the S&P 500 and Nasdaq 100 which rose by 4.5% and 6.25% respectively.
 Source: Google Finance
This underperformance has been even greater versus its European counterparts such as the CAC 40, DAX 40 and Euro Stoxx 50 which all rose between close to 7% % to 7.5% over the past couple of weeks.
Only the Dow Jones Industrial Average with a positive start to the year of around 3.5% year-to-date seems to be lagging the FTSE 100 while the FTSE 250 advanced by a slightly higher 4.5% this year so far.
 Source: Google Finance
Unless inflation picks up again, together with energy prices, the FTSE 100’s outperformance of 2022 seems to have been an exception and is unlikely to repeat anytime soon.
Having said that, with several commodities such as gold, copper and aluminium, for example, making between seven- to nine-month highs and which are expected to rise further still, the FTSE 100 should benefit.
What are the technical upside targets for the FTSE 100?
Once the May 2018 peak at 7877.45 has been overcome, the psychological 8,000 mark will be in focus but may well stall the index’s advance as round numbers often tend to do.
 Source: Refinitiv Datastream
The January 2000 peak, for example, was made marginally below the psychological 7,000 mark, at 6,930.2, and the April 2015 peak at 7,103.98, not that far above the round number.
It thus wouldn’t be surprising if the FTSE 100 were to trade within 100 to 200 points, either above or below the 8,000 mark, in the first quarter of this year.
In the short-term, meaning this week, the FTSE 100, alongside other global equity indices, is likely to lose some of its recent strong upside momentum as it becomes ever more overbought, as can be seen by the high reading of oscillators such as the Relative Strength Index (RSI) which is trading above 80%, close to its end of November peak which was followed by the December sell-off.
 Source: Refinitiv Datastream
But even if a short-term correction lower were to be seen over the next few days, provided that the early January low at 7451.74 isn’t being slipped through, the medium-term uptrend remains intact.
Immediate support can be spotted around last Monday’s high at 7,724.94 and more significant support around the December peak at 7,558.49.


0 Comments
Recommended Comments
There are no comments to display.
Create an account or sign in to comment
You need to be a member in order to leave a comment
Create an account
Sign up for a new account in our community. It's easy!
Register a new accountSign in
Already have an account? Sign in here.
Sign In Now