All eyes on US CPI data ahead: S&P 500, Hang Seng Index, Silver

Entry posted by MongiIG in Market News
662 views
US equity indices kickstart the new trading week on a positive footing, but much remain up in the air as all eyes fall on the US CPI release ahead.
 Source: Bloomberg
Market Recap
US equity indices kickstart the new trading week on a positive footing, as a pause in Treasury yields’ ascent ahead of the key US Consumer Price Index (CPI) data aided to drive a broad-based recovery, notably in big tech stocks. The energy sector is the only outlier (-0.60%), being forced into negative territory on lower oil prices, as Biden Administration’s plans to sell 26 million barrels of crude oil from its Strategic Petroleum Reserve gave rise to an increased-supplies outlook. The US dollar remained in its ranging pattern despite a 0.6% decline overnight, largely on some wait-and-see for the US CPI to provide any added boost.
On the economic calendar, the New York Federal Reserve’s (Fed) survey saw US consumers' one-year inflation expectation staying unchanged at 5% in January, while markets were not given a break from hawkish Fedspeak. Fed Governor Michelle Bowman continued to echo for more rate increases overnight but no specifics on peak rate was given. Much will still depend on the upcoming US CPI data to sway market rate expectations. Matching or below-estimate readings could see risk environment improve further (core inflation expected at 5.5% year-over-year (YoY), headline expected at 6.2% YoY), while any upside surprise will see the US dollar rallying higher and equities lower.
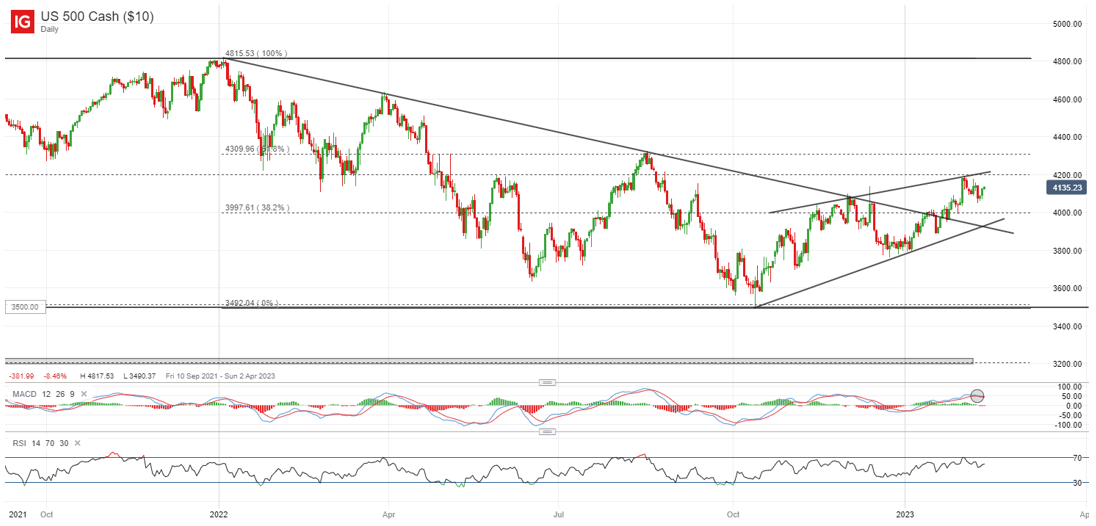
The S&P 500 continues to trade on a series of higher highs and higher lows since October 2022, providing an overall upward bias on the broader trend. On the upside, the 4,200 level will stand as resistance to overcome, where the index failed to break above at the start of the month. Overcoming this level could leave the 4,310 level in sight, where a key 61.8% Fibonacci retracement level resides. On the downside, the key psychological 4,000 level will be in focus as near-term support.
 Source: IG charts
Asia Open
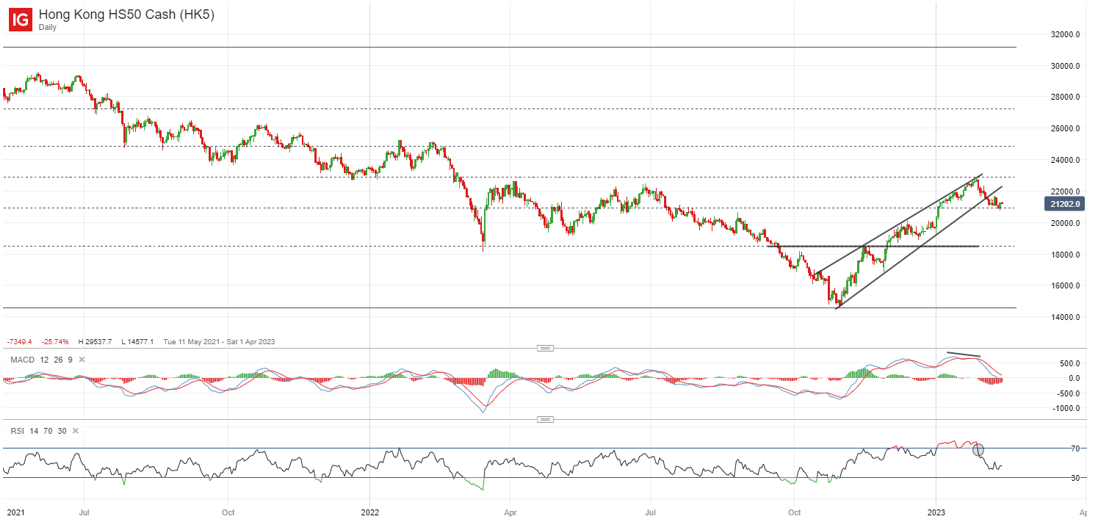
Asian stocks look set for a positive open, with Nikkei +0.66%, ASX +0.35% and KOSPI +0.50% at the time of writing. Sentiments are largely tracking the positive handover from Wall Street overnight, although much is still up in the air, with the upcoming US CPI likely to drive sentiments for the weeks ahead. The Nasdaq Golden Dragon China Index (+2.6%) got a lift overnight as well. The Hang Seng Index is attempting to stabilise after recent profit-taking activities, currently sitting at a 38.2% Fibonacci retracement level at the 20,900 level. A break below an upward trendline provides a mixed view for short-term moves however, with further retracement likely to leave the 19,200 level on watch for any formation of a higher low.
 Source: IG charts
Economic data this morning left markets with a disappointing fourth-quarter Gross Domestic Product (GDP) data out of Japan, with the preliminary reading coming in below expectations at 0.2% quarter-on-quarter (0.5% consensus). The data is supportive of a lower-for-longer stance from the Bank of Japan (BoJ) and for any tighter shift in policy moves towards the second half of the year, a more gradual transition will likely be on the table. The Nikkei 225 index has seen some downward pressure on the data release but continues to hang just below its 27,650 level of resistance. Any subsequent push above the level could potentially pave the way to retest the 28,400 level next.
On the watchlist: Silver prices hanging at key $22.00 support ahead of US CPI data
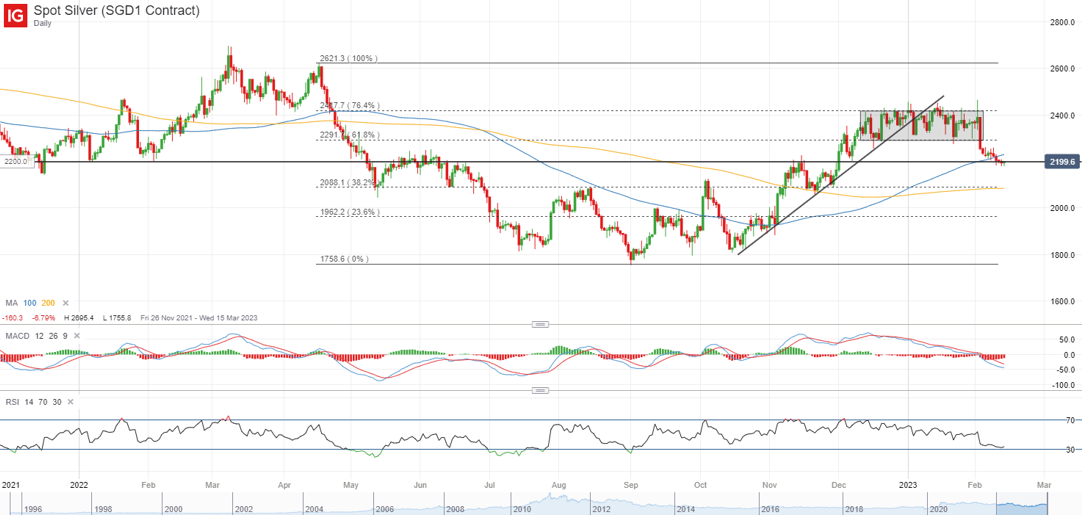
Silver prices have been struggling to find upside on some resilience in the US dollar lately, following a break below a previous consolidation pattern back in early February. The moving average convergence/divergence (MACD) has also headed into negative territory for the first time since November 2022, potentially reflecting some reversal in momentum to the downside. With the US CPI up ahead, muted moves to start the week reflect some wait-and-see as prices hang at its key $22.00 level of support. Failure to hold above the $22.00 level over the coming days could pave the way to retest the $20.80 level next, where a key 38.2% Fibonacci retracement level resides.
 Source: IG charts
Monday: DJIA +1.11%; S&P 500 +1.14%; Nasdaq +1.48%, DAX +0.58%, FTSE +0.83%


.jpeg.98f0cfe51803b4af23bc6b06b29ba6ff.jpeg)

0 Comments
Recommended Comments
There are no comments to display.
Create an account or sign in to comment
You need to be a member in order to leave a comment
Create an account
Sign up for a new account in our community. It's easy!
Register a new accountSign in
Already have an account? Sign in here.
Sign In Now